When you feel like your system is working slower than usual, the first thing that comes up is “Check the resources being used,” In Linux, multiple tools are similar to the task manager (as in windows), all of which have pros and cons. These are pretty useful for monitoring what process consumes how many resources, and you can watch the state of your network.
Today we bring you the seven system monitoring tools for Linux, which are better than the currently trending tools on the market in terms of features.
This guide gives an overview of the seven system Monitoring tools for Linux that are better than the “top”.
And now, we’ll give a brief introduction to the tools mentioned above.
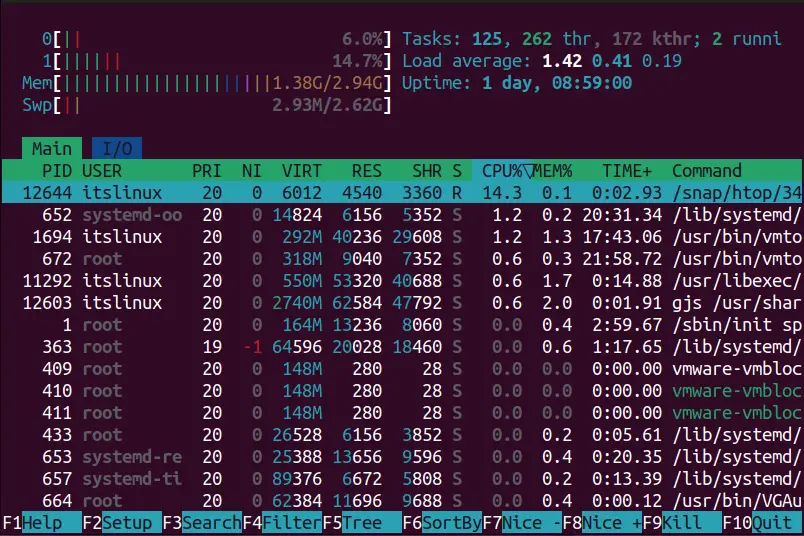
1. htop
Although there’s no ranking of what we call the best system monitoring tools for Linux, htop is among the best. It lets the users monitor their system’s resources in quite an organized way by adding colors, mouse interaction, filtering, and killing processes.
$ htop
How to Install htop on Linux?
You can install it using one of these commands if it isn’t pre-installed (it is on most distros).
$ sudo apt install htop                       #For Ubuntu/Debian
$ sudo dnf install htop                       #For Fedora
$ sudo pacman -S htop                       #For Arch Linux
If your OS is other than the above, follow this installation guide to install it on other systems.
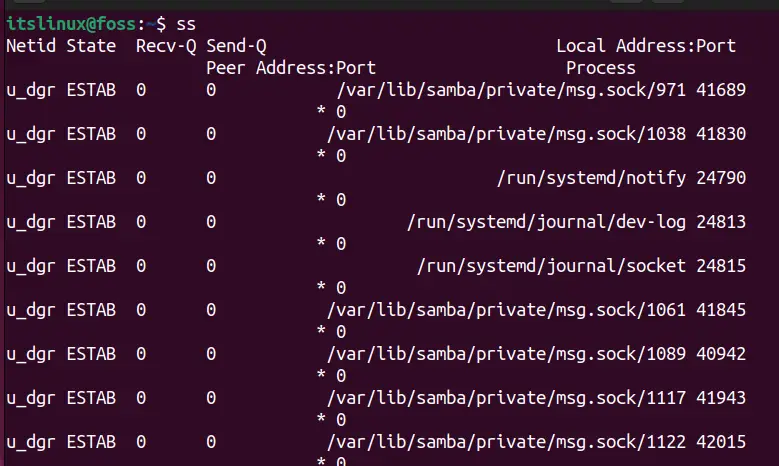
2. ss
You may have heard or used the good old netstat command, which displays the network information, and here we have the ss command that is relatively better in all aspects. It is mainly used to troubleshoot network-related issues and has lots of options to be used.
$ ss
How to Install ss on Linux?
It is pre-installed in all Linux distros but can be installed using one of these commands if it isn’t.
$ sudo apt install iproute2                     #For Ubuntu/Debian
$ sudo dnf install iproute2                     #For Fedora
$ sudo pacman -S iproute2                  #For Arch Linux
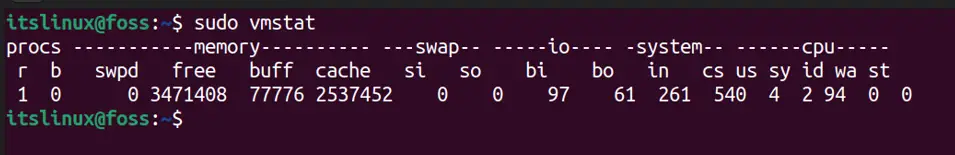
3. vmstat
Virtual Memory Statistics or vmstat is a command-line tool that views information like CPU, disk scheduling, IO, paging, and processes. A lot of options are there that you can use to get the information more effectively.
$ sudo vmstat
How to Install vmstat on Linux?
It is pre-installed in all the distros of Linux but can be installed using either of the following commands.
$ sudo apt install procps                     #For Ubuntu/Debian
$ sudo dnf install procps                     #For Fedora
$ sudo pacman -S procps                      #For Arch Linux
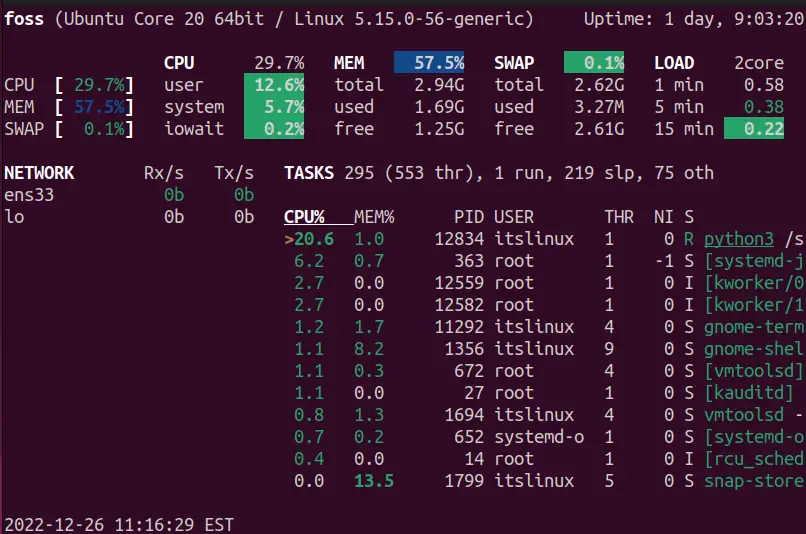
4. Glances
My personal favorite tool to monitor my system is Glances due to its ability to display all the stats (15+) in one place, and it is written in Python; you can expect more features to come up pretty soon.
Comprehensive documentation is one of its few features, and there’s a web mode using which you can monitor your system remotely through the web browser, which is impressive.
$ glances
How to Install glances on Linux?
This command can install it using the snap store on all Linux distributions.
$ sudo snap install glances
5. free
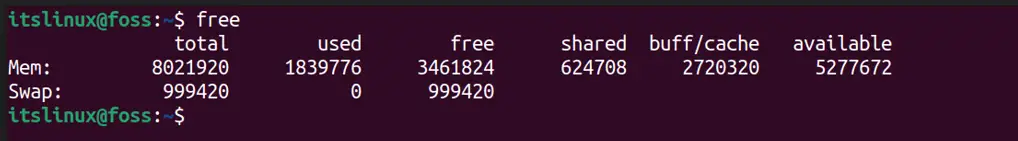
The free command of Linux is used to check memory statistics. It allows the users to view the total, used, and free memory. The shared and cache are also displayed. This command-line tool lets you see how much of your system’s RAM is used.
$ free
How to Install free on Linux?
It is one of the essential command-line tools pre-installed in all the distributions of Linux, but if it isn’t, you can install it using these commands.
$ sudo apt install procps                     #For Ubuntu/Debian
$ sudo dnf install procps                     #For Fedora
$ sudo pacman -S procps                      #For Arch Linux
6. bashtop
The bashtop may require more resources to work, but the information it displays is all worth it, and you can increase its functionality through the installable modules from its GitHub. There are unique options like process filtration, switchable sorting, and much more.
$ bashtop
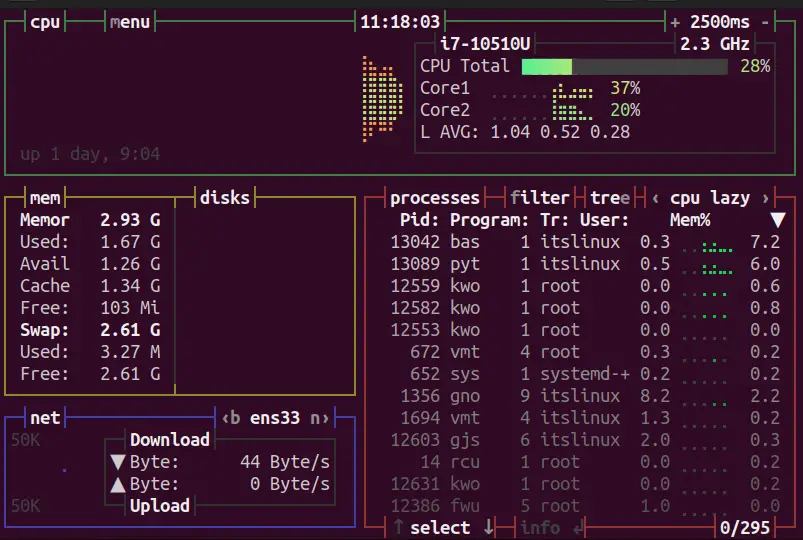
It is perhaps the best tool to keep an eye on your system’s resources.
How to Install bashtop on Linux?
It can be installed on various Linux distributions with snap support enabled via the following command.
$ sudo snap install bashtop
7. nmon
Displaying the stats of the system’s resources, Nigel’s performance Monitor (nmon) is used; we included it in the list because of the information breakdown (one by one & toggleable) that it does. The displayed stats are colored, which makes them easier to read.
$ nmon
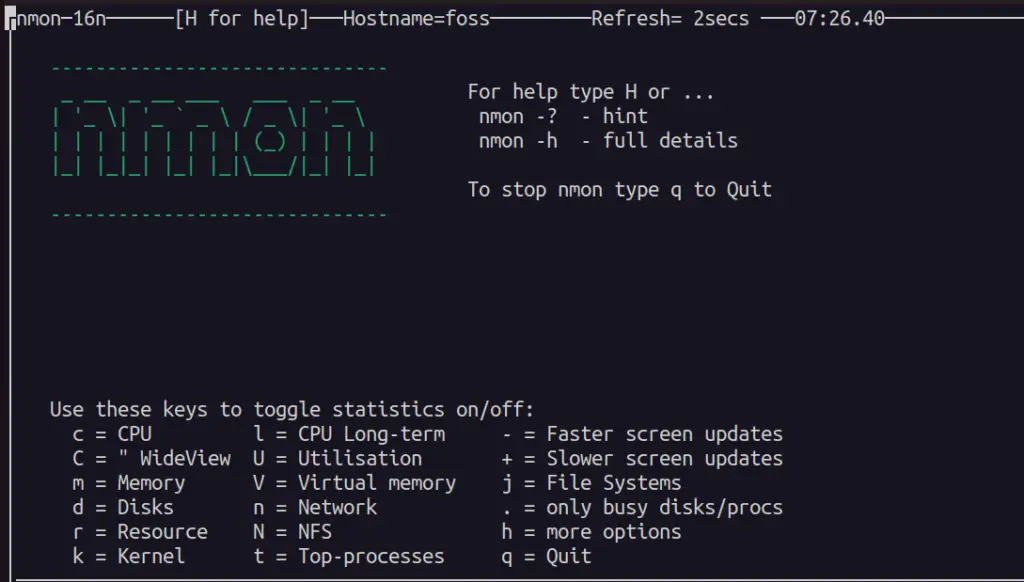
As seen in the above image, multiple options can be selected using a key to display the related information.
How to Install nmon on Linux?
It is already installed in almost every distro of Linux; however, you can install it using these commands.
$ sudo apt install nmon                       #For Ubuntu/Debian
$ sudo dnf install nmon                       #For Fedora
$ sudo pacman -S nmon                        #For Arch Linux
These are all the best tools and alternatives to the top.
Conclusion
Checking the system’s resource usage is always a good practice because sometimes the system can overheat while in full use, which causes a crash, thus losing all unsaved data. This guide shows the seven System Monitoring Tools above the best features of the top.