Monitoring CPU utilization can help you identify which applications use the most resources on your system. Following CPU usage, you can optimize system performance by closing or limiting unnecessary applications. High CPU utilization may indicate that the CPU is struggling to meet the demands of the workload, which can lead to performance issues.
This article will focus on giving you the detailed guideline on how you can check CPU Utilization in Linux by following the content discussed below:
Let’s start the discussion of checking CPU utilization with the command line method.
Checking CPU Utilization Via Command Line?
In this section, we will discuss different commands you can execute to check CPU utilization information.
Using the top Command
The “top” command is an interactive system monitor that displays the CPU utilization and the usage of other system resources in real-time. To view the CPU utilization, press the ‘1’ key while the top is running. This will show the CPU utilization for each individual CPU core.
$ top
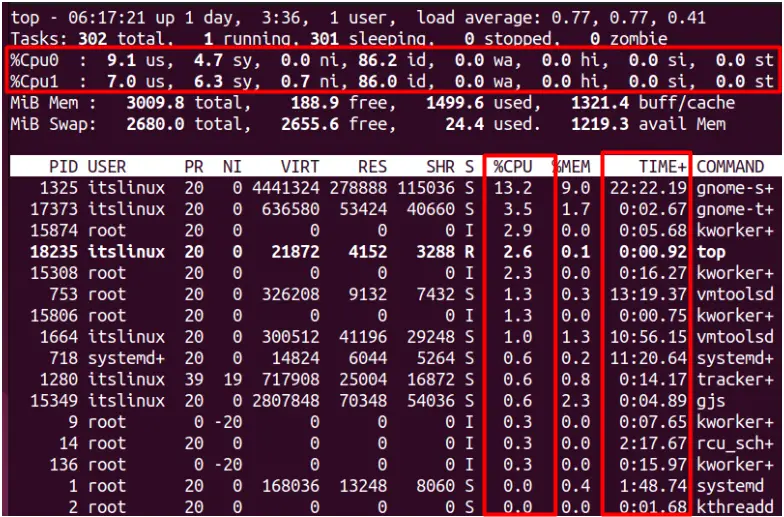
The CPU section of the top command displays information about the usage of the CPU on the system.
Using the htop Command
The “htop” is an interactive system monitor for Linux that allows you to view and control processes on your system. It displays system resources, including the CPU utilization, memory usage, and load average, in real-time. You need to install this package first by typing the below command and only then you would be able to use it:
$ sudo snap install htop
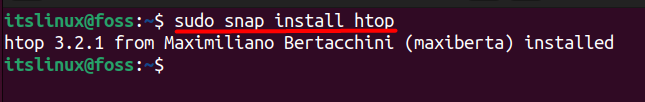
After successfully installing it you can run this command by typing:
$ htop
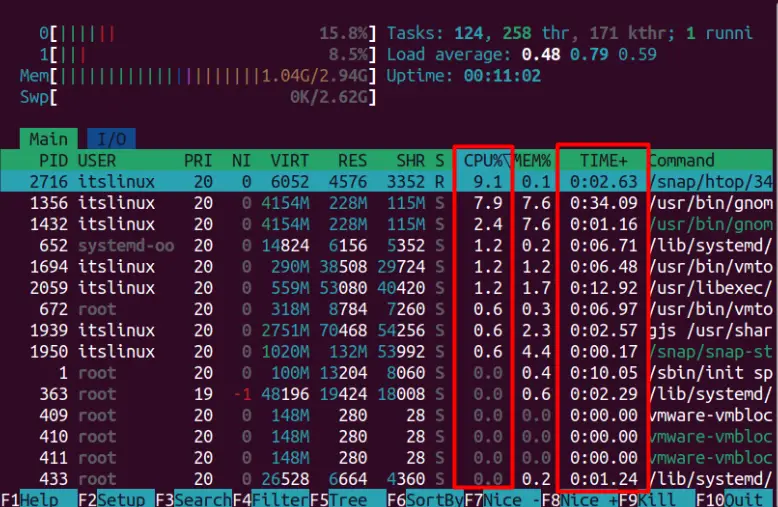
Different running processes can be seen in the above image and their CPU utilization in terms of percentage can be seen in the “CPU%” field. The “Time+” shows how long that process utilizes the CPU so the high load process can be optimized to improve the system performance.
Using the mpstat Command
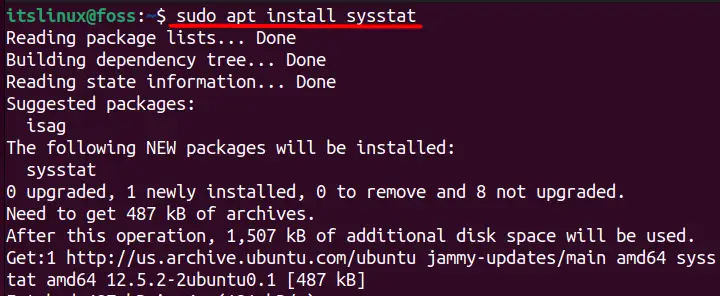
The ‘mpstat’ command is a tool that displays the CPU utilization for each individual CPU core. To use it, install the “sysstat” package, which includes tools for collecting and reporting on data such as CPU utilization, memory usage, and network activity.
$ sudo apt install sysstat
For other distributions, you can install it using the following commands:
$ sudo dnf install sysstat 			#For Fedora
$ sudo yum install sysstat				#For CentOS
After installing this package, you can run the “mpstat” command by typing:
$ mpstat
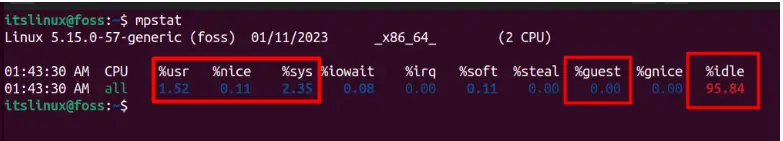
You can see the CPU process-related information in the above image.
Using the vmstat Command
The ‘vmstat’ command is a tool that displays statistics about system memory, processes, and CPU utilization by running the following command:
$ vmstat
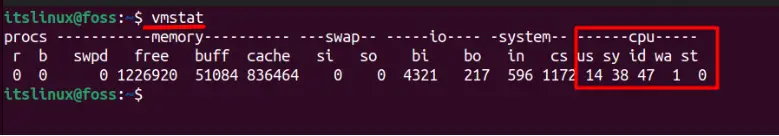
In the above image, you can see the CPU core information to monitor the system performance and identify which core is causing the performance issues. This will help you identify the core that has a high wait time or high usage so you can take action to optimize the system.
Using the sar Command
In Linux, the sar package is a command-line utility for collecting and displaying system activity information. It collects data about various system resources, including CPU utilization, memory usage, network activity, etc., and stores the data in files located in the /var/log/sysstat directory. The sar command can view the collected data in various formats, such as averages, summaries, and graphs.
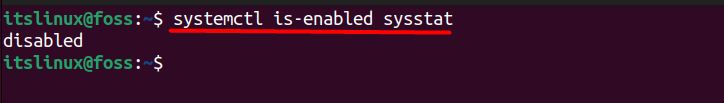
You need to enable the sysstat package first to use this command, and you can check its status by typing:
$ systemctl is-enabled sysstat
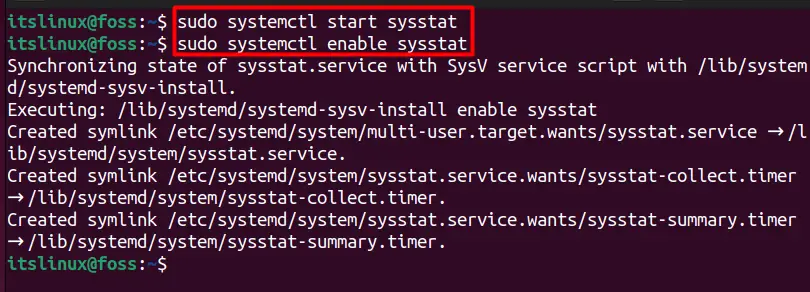
After that, you need to start and enable the services for the sysstat package by typing:
$ sudo systemctl start sysstat
$ sudo systemctl enable sysstat
Now, you can verify the status of the sysstat package again by typing:
$ systemctl is-enabled sysstat
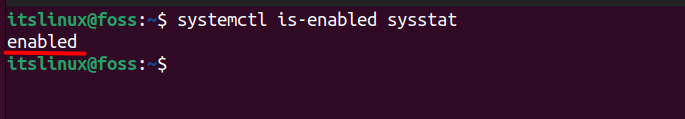
As it is now enabled, you should be able to execute the sar command by typing:
$ sar -u 5
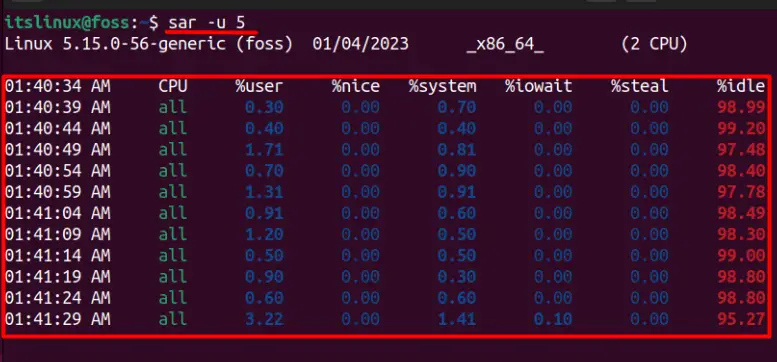
The ‘u’ flag in the above command is mainly used to provide the CPU utilization information whereas this information will be displayed after every 5seconds.
Using the iostat Command
Sysstat also includes a command-line tool called iostat, which is used to monitor CPU utilization and I/O statistics of a system. You can use the iostat command to monitor your system’s performance over time and identify any bottlenecks or performance issues that may be occurring.
$ iostat
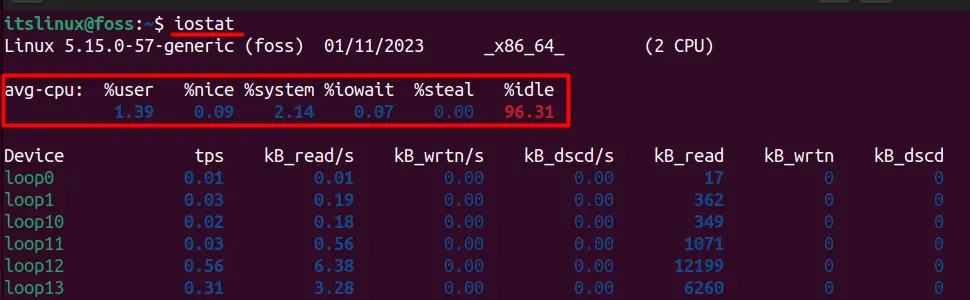
This command displays information about your computer’s CPU and I/O utilization.
How to Check CPU Utilization Via GUI?
You can also check the CPU utilization information via GUI as well, and for that, you can type the following command:
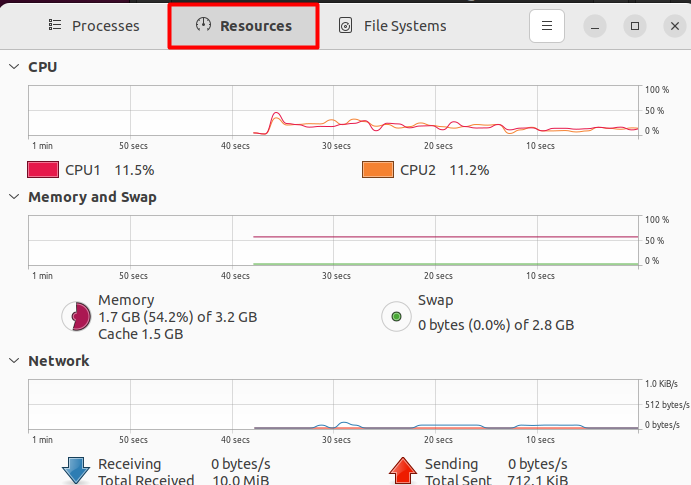
$ gnome-system-monitor
When you run this command in Ubuntu 22.04 then, a new window will appear, providing you with the relevant information as shown:
If this application is not installed in your Linux distribution, then you can do that by typing:
$ sudo apt install gnome-system-monitor		# For Ubuntu
$ sudo dnf install gnome-system-monitor		# For Fedora
$ sudo yum install gnome-system-monitor		# For CentOS
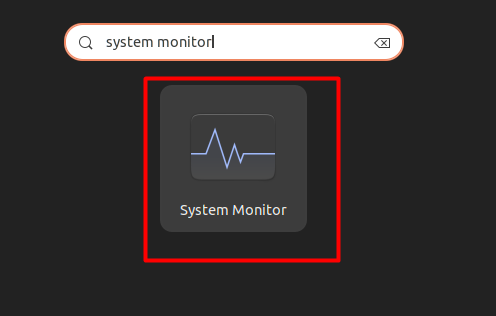
You can also search for the ‘system Monitor’ application via application manager and this will also give you the same result:
Conclusion
Checking CPU utilization on a Linux system is a useful and important task for system administrators. It can be done by using some command line tools, i.e., top, htop, and ps. Moreover, a GUI application named “System Monitor” can also be installed and used to get CPU utilization. All these command line tools and the GUI method are briefly explained in this post.