Most Linux distros come with built-in server monitoring commands, which help us to track the server and system activities. The system monitoring tools find the possible causes for the low system performance. The monitoring commands are beneficial in debugging & troubleshooting the system issues to improve the system server security.
There are several server monitoring commands in Linux which manage the server in different ways. This guide will cover the below server monitoring commands with their usages:
Let’s begin with the top system monitoring command.
1. top Command
The top Command is the best system performance monitoring tool to manage processes. In most Linux distros, the top command compactly displays the currently running process, including the system’s memory and CPU consumption.
It helps to manage the processes in real-time and updates every process after a few seconds. It allows ordering the large/low processes with a single click based on memory usage or PID.
The system running processes can easily be accessed using the “top” command to open the server monitoring the interface.
$ top
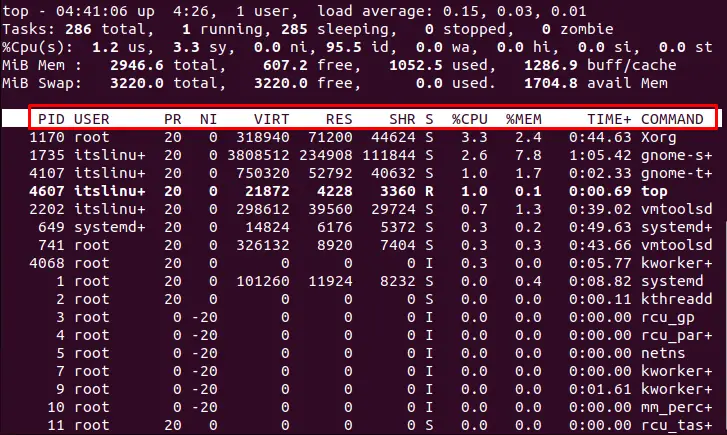
The above top command output shows the following features of the running process:
- Process ID
- CPU utilization
- Memory consumed
- State of the running processes
- Uptime for a specific process
Example 1: Sort Processes Based on %CPU
We can sort the system running processes based on %CPU usage with the shortcut key “Shift + P” or “P” as indicated in the below picture:
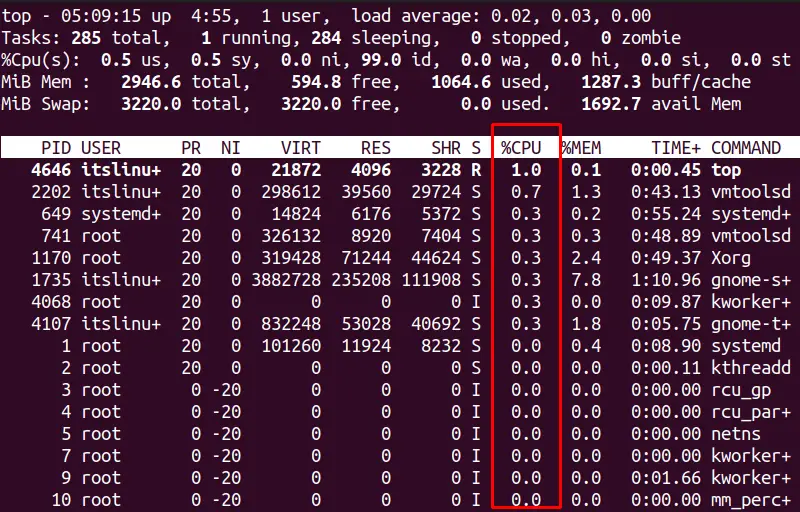
The %CPU is sorted in ascending order, and the user can get which process consumes more CPU.
Example 2: Kill a Specific Process
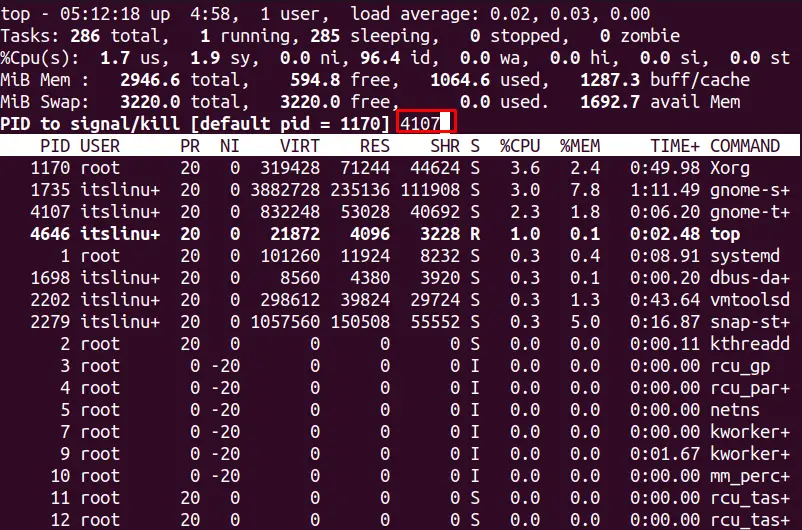
The top command helps us to kill a process utilizing the capital “K” shortcut key. For killing a particular process, press the “K” key and enter the specified PID. Press the “Enter” key to kill that process.
Let’s discuss the next command.
2. ps Command
The ps stands for “Process Status” command helps us to monitor the processes by showing the current processes. The ps command lists running processes in the terminal with PID, time running for the process, and other details.
The ps command provides the information for the administrative tasks and enables us to determine the technical details of the processes.
The ps command syntax is written below:
Syntax:
$ ps [option] <user-name>
Let’s work on the practical use of the ps command.
Example 1: List all Processes in the System
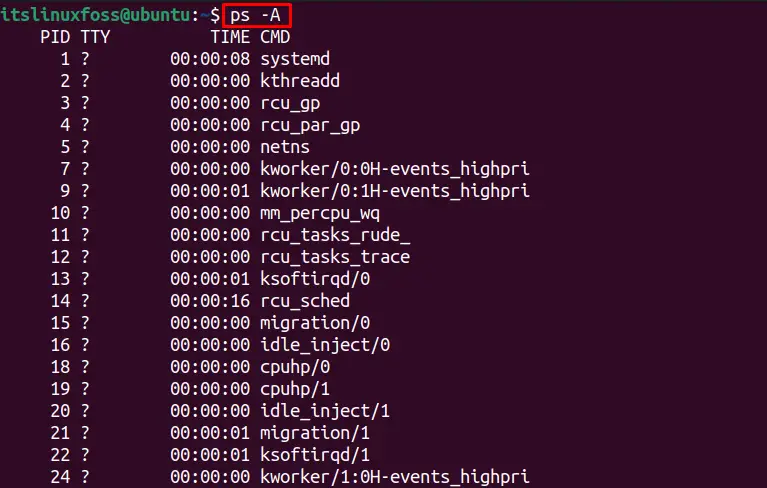
The ps command performs different functions based on its options. The “A” option allows the ps command to list all the ongoing processes as follows:
$ ps -A
Example 2: List Processes for a Specific User
The “u” option enables the system monitoring process for a specific user. For listing the processes of the “itslinuxfoss” user, execute this command:
$ ps -u itslinuxfoss
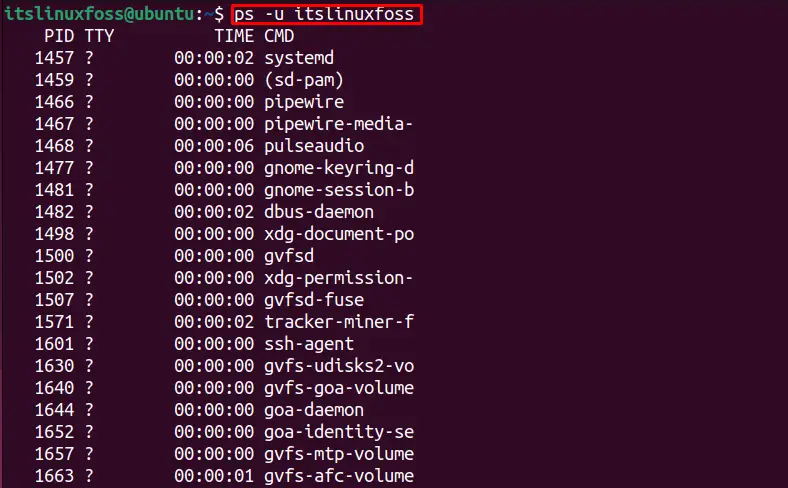
All processes associated with the “itslinuxfoss” user are displayed in the above output.
3. vmstat Command
The vmstat, abbreviated as Virtual memory statistics, is a default system monitoring utility in Linux. This command line tool gives information about the system processes that help to determine the performance of the system.
To use the vmstat command, the syntax is given below:
Syntax:
$ vmstat [option] [delay [count]]
The components of the command is described below:
- option: Replace with built-in options.
- delay: Number of seconds to schedule the vmstat command after the specified delay time (seconds).
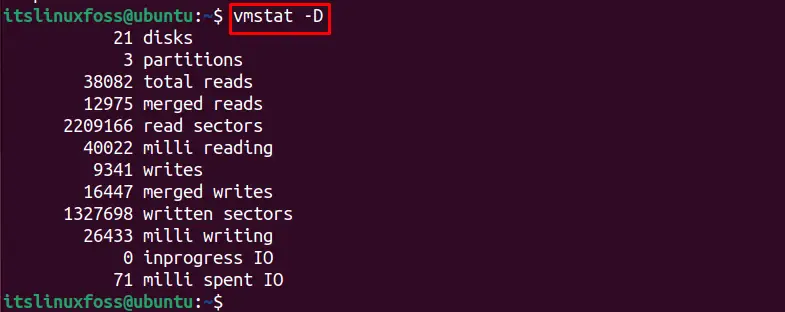
Example 1: Summarize Disk statistics
The vmstat command comes with a “D” option, which shows a summary of the disk statistics for the system:
$ vmstat -D
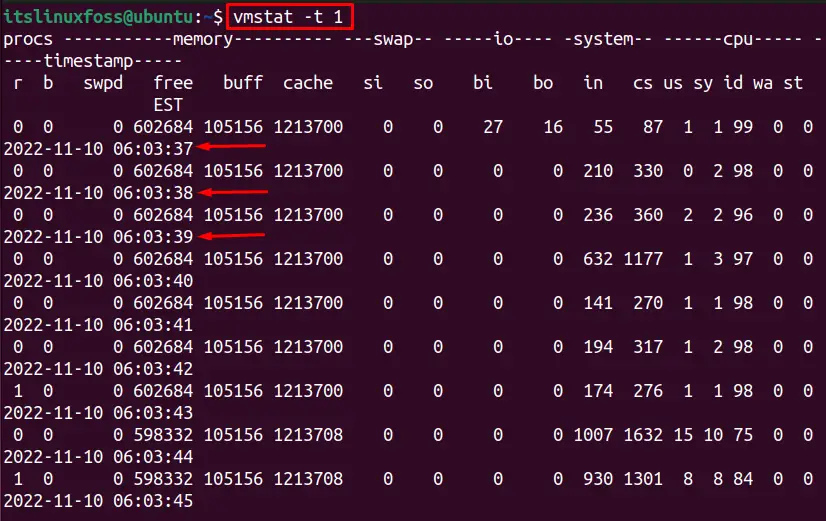
Example 2: Schedule the Process Timestamp
The vmstat allows you to monitor the system execution after a certain delay time with the “t” option. To display the timestamp after every second, use the following command:
Note: “1” shows the delay time in seconds.
$ vmstat -t 1
4. lsof Command
The lsof short of the “list open files” command displays the currently open files and their related processes utilizing those files. In Linux OS, the lsof command reads the Kernel memory files like; “/dev/mem”, and/dev/kmem to fetch the details about the Kernel.
The lsof command follows this syntax:
Syntax:
$ lsof [option] [property]
The syntax components are:
- option: Put available lsof option.
- property: Replace with the desired property like; username, file name, PID, command, etc.
Let’s check its practical usage.
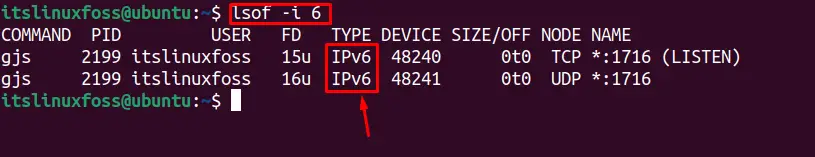
Example 1: Show Opened Files for a Specific Network Interface
The “i” option allows you to check the open files in the system for a specific network interface like; ipV4 or ipV6. For instance: to get the files working on the ipV6 network interface, utilize this command:
$ lsof -i 6
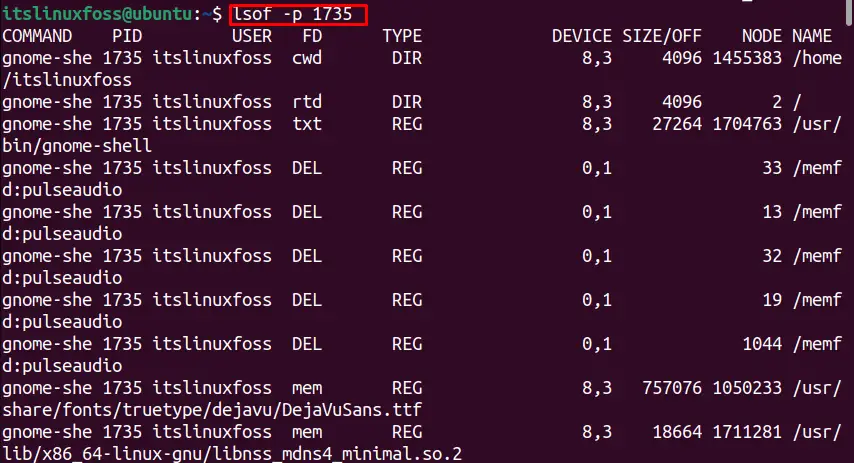
Example 2: Show Opened Files for a PID
The files related to a specific PID can be displayed utilizing the “p” (process) option of the lsof command. For the PID “1735”, execute this command:
$ lsof -p 1735
5. free Command
Another powerful server monitoring command in Linux is “free”. The free command shows the Linux server memory usage, including actual memory (RAM) and swap memory (used in case the actual memory is full). This command allows the users to analyze the disk space and determine the free space for the new applications.
The general syntax for the free command is mentioned below:
Syntax:
$ free [option]
Let’s practice some examples on it:
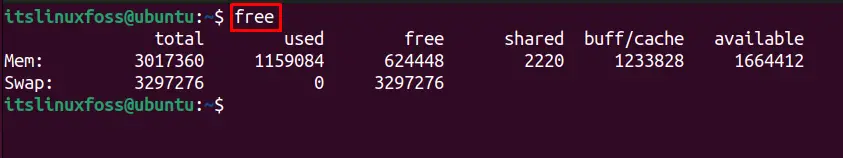
Example 1: Show All Memory Details
Running the free command without any option gives you each memory within the system as written below:
$ free
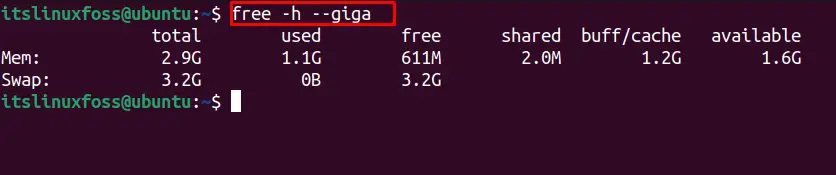
Example 2: Show Human Readable Memory Details in Giga Bytes
The free command “h” option gives the human-readable output, and “–giga” displays the data in Giga bytes as shown below:
$ free -h --giga
6. tcpdump Command
The tcpdump command behaves as a Network packet Analyzer in Linux that troubleshoots and identifies the network problems. If you are working with the internet and issues arise, the tcpdump is helpful to diagnose the connectivity issues in Linux. It monitors the network traffic in your system & checks the issues, and is also used as a security tool.
The tcdump command has the following syntax:
Syntax:
$ tcpdump [option]
The following examples use the “tcdump” command:
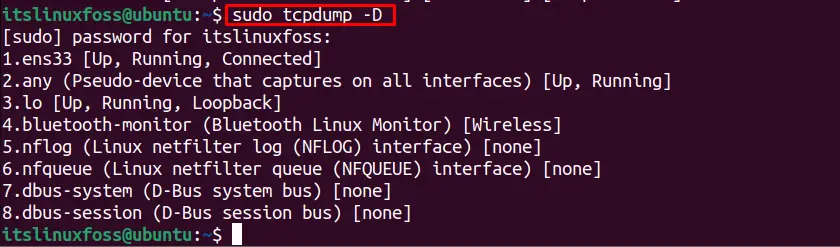
Example 1: Capture Data Packets Using tcpdump
Several interfaces may be utilized to capture the packets. For getting the list of interfaces, the “D” option is used as follows:
Note: The “root” permissions are required to access the data by this command.
$ sudo tcpdump -D
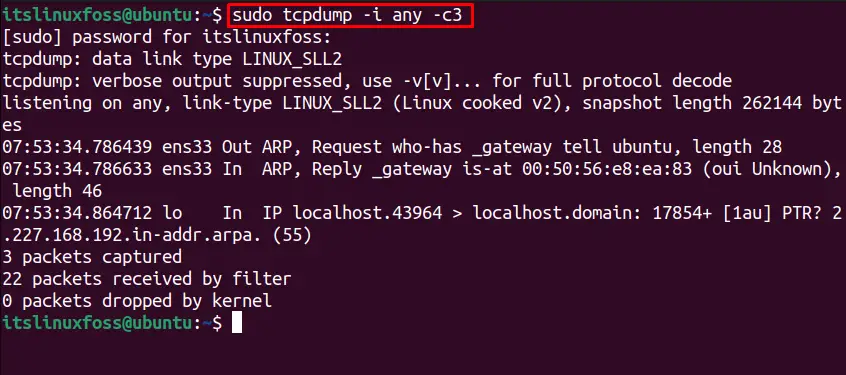
Example 2: Capture Specific Data Packets Using tcpdump
The “c” (count) option of the tcpdump commands restricts the data packets to a specific limit. For instance, to fetch the three (3) data packets, execute this command:
$ sudo tcpdump -i any -c3
7. netstat Command
The nestat command, abbreviated as (Network statistics), is a networking utility that works as a troubleshooting and configuration tool. It is operated as a monitoring tool for network devices. The netstat command controls the incoming and outgoing internet connection statistics.
The netstat command’s syntax is written below:
Syntax:
$ netstat [option]
Let’s use it in various scenarios.
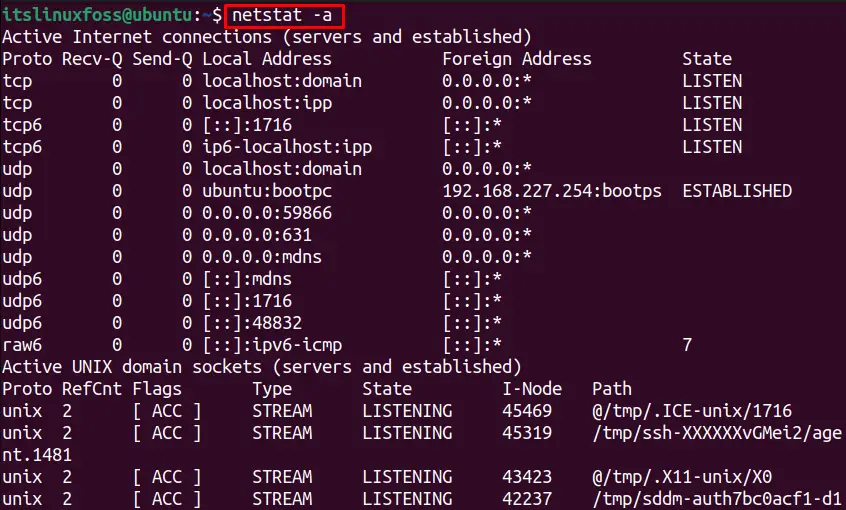
Example 1: Netstat Command to Show All Listening Ports
The “a” option of the netstat command shows the listening ports, including TCP and UDP protocol. The below command displays all the technical details about a network device.
$ netstat -a
Example 2: netstat Command to Show I/O Interface
The netstat option “i” allows you to display the interface tables and helps troubleshoot network problems.
$ netstat -i
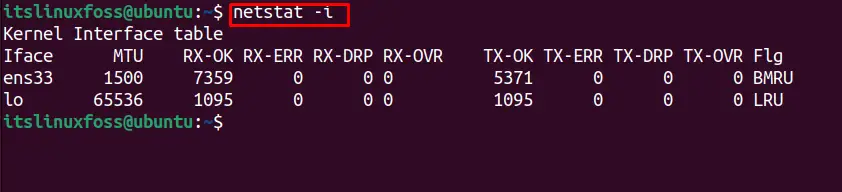
The output displays different network interfaces like; “ens33” (input) & “lo” (output) with other technical details about the interface.
Conclusion
Several commands are used as server monitoring tools, like; top, ps, vmstat, lsof, free, tcpdump, and netstat. These commands help monitor the system performance and manage the running processes efficiently. Each command has its functionality and scope of operation. This post has briefly explained the numerous Linux server monitoring commands.