The GNU debugger is the most popular debugger and is installed by default in Linux distributions that debug C or C++ and other programming languages. To use the GNU debugger efficiently, you must know the GDB commands which can be invoked via the terminal or within the GNU debugger to perform the task.
This guide will provide you with the GDB commands cheat sheet and explain the important commands.
List of GDB Commands in Linux
The below table shows the available GDB commands which can be used as the cheat sheet for beginners working with the GNU debugger:
| break main b b 1 b +2 b <function-name> | It sets a breakpoint at the start of the program. It sets the breakpoint on the current line. It sets the breakpoint at line number 1. It sets breakpoint 2 lines after the current line. It sets the breakpoint before the given function. |
| quit or q | It exits the GNU debugger/program. |
| run or r | This command runs the program until a breakpoint or error occurs. |
| help <command> help running | It shows the helping text for the given command. It shows the helping text for the running command. |
| continue or C <count> | It continues to run the program until the breakpoint or an error occurs. |
| next or n | Prints the next line. |
| delete or d d 2 | It deletes breakpoints or checkpoints. It deletes the breakpoint number 2. |
| disable 2 enable 3 | It disables the breakpoint number 2. It enables the breakpoint number 3. |
| info <command> info breakpoints | It displays the information about the command. It shows the information about the breakpoints. |
| set <args> | It sets the arguments provided to the program. |
| show args | It shows all the program’s arguments. |
| checkpoint | This command creates a checkpoint. |
| print or p p variable1 | Prints the value. Displays the value of the variable1. |
| file <executeable-filename> | It opens the executable file. |
| s | Executes the next line from the current position in the program. |
| s 2 | Executes the next 2 lines of the program. |
What the GDB Commands Do?
This section explains the important GDB commands in Linux with the help of examples.
Basic Compilation of GDB File
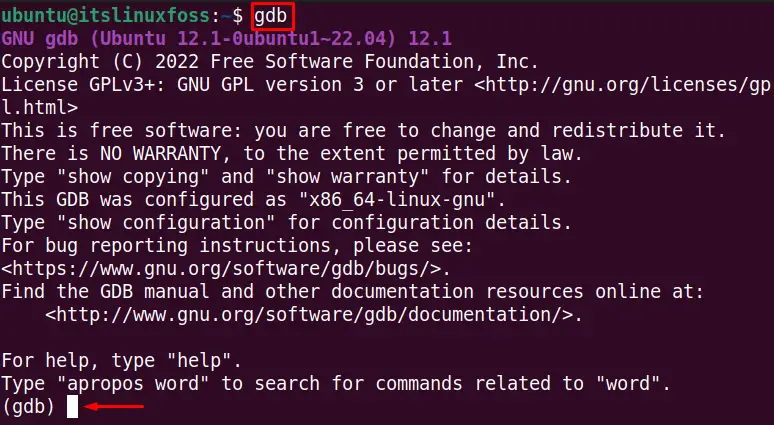
The gdb debugger can be opened by writing the gdb in the terminal as shown below, which allows the users to enter the commands to perform the desired tasks while running the programs:
Note: The executable file must be opened in the debugger to execute the commands.
$ gdb
This article will be performed using the code below with the filename “testgDb.cpp”. This code is written in C language, which has a function named “cube” that performs the cube to the number provided by the user:
#include <iostream>
#include <stdlib.h>
#include <string.h>
using namespace std;

int cube(int a)
{
    return a * a * a;
}

int main(int n, char** args)
{
    for (int i = 1; i < n; i++)
    {
        int a = atoi(args[i]);
        cout << cube(a) << endl;
    }
    return 0;
}
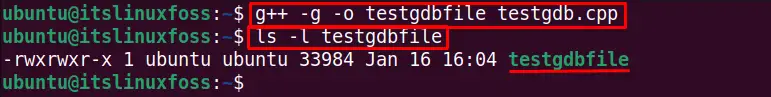
To open the code in the debugger command prompt, we must make the code executable. To make the above file named “testgdb.cpp” into an executable file named “testgdbfile”, run the following command:
Note: The ls command is used to verify that the testgdbfile is successfully created.
$ g++ -g -o testgdbfile testgdb.cpp
$ ls -l testgdbfile
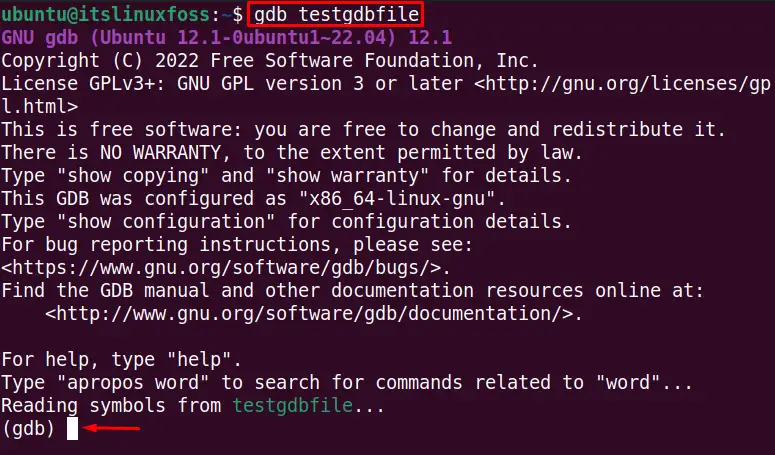
Let’s open the testgdbfile executable file in GDB debugger with the below-mentioned command:
$ gdb testgdbfile
Use the gdb Command to Pass the Argument
The testgdbfile contains the cube function executable code, which takes a single argument from the user. We can run the gdb file by passing the argument (in this case, 10) as shown below:
$ run 10
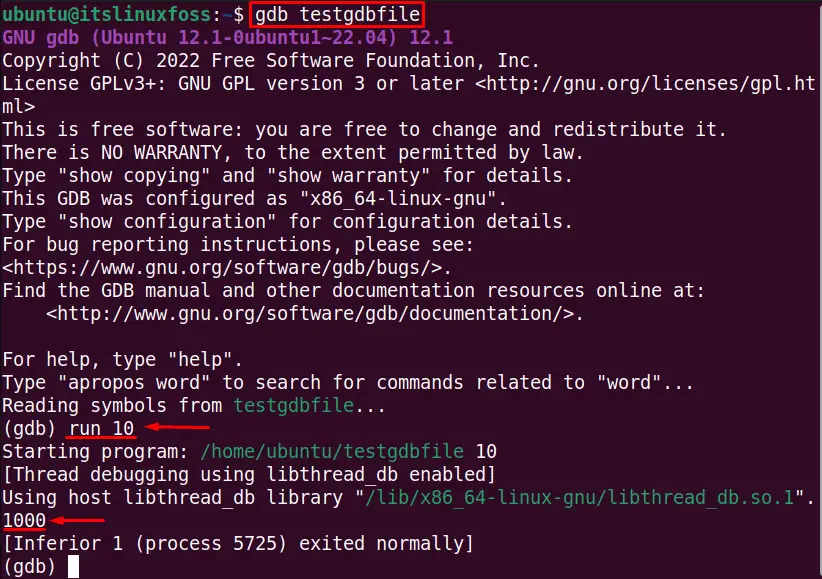
The output shows the cube of the passed value as “1000”.
Show the Help Section of the GDB Commands
The “help” is a very important gdb command in Linux that shows the manual about the given command. If the help command is used without any command, it shows all the gdb commands as seen below:
$ help
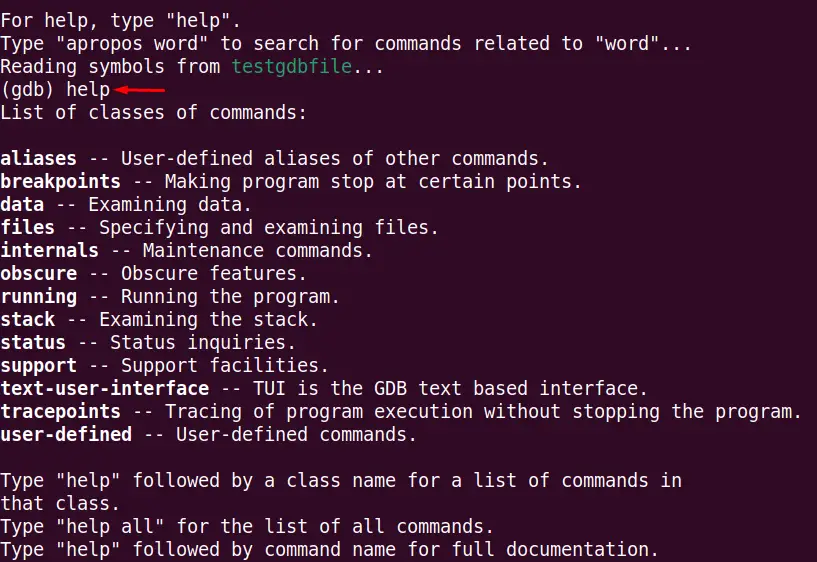
The output shows the commands available for the GDB.
Add Breakpoint to a Program
The breakpoint can be added to the program or function to stop the execution. The breakpoint helps the users to run a portion of a program or function, which is important for testing purposes. To add a breakpoint before a function named “cube”, execute this command in GNU debugger:
$ b cube
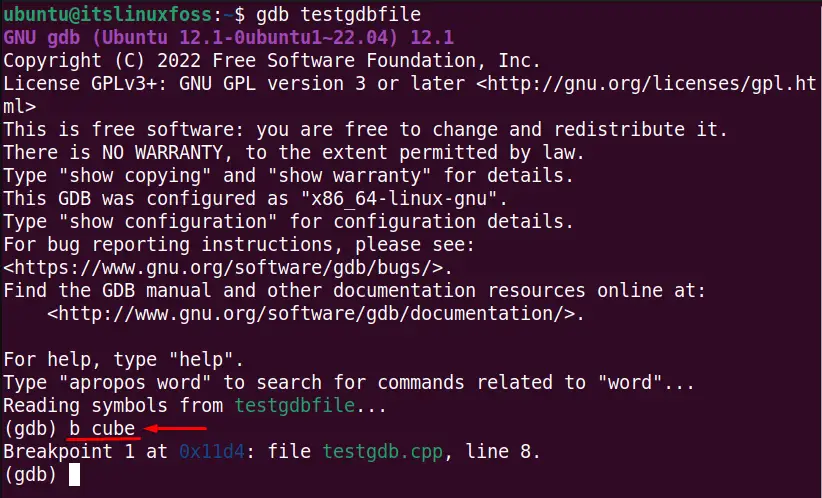
The breakpoint is added before the function “cube” at line 8. The breakpoint can be used in several other ways, as mentioned in the above table.
Continue the Program From the Breakpoint
The continue is used to continue the program instead of the breakpoint. The breakpoint stops the execution at a certain point while the continue is used to continue from a specific breakpoint, as shown below:
$ continue
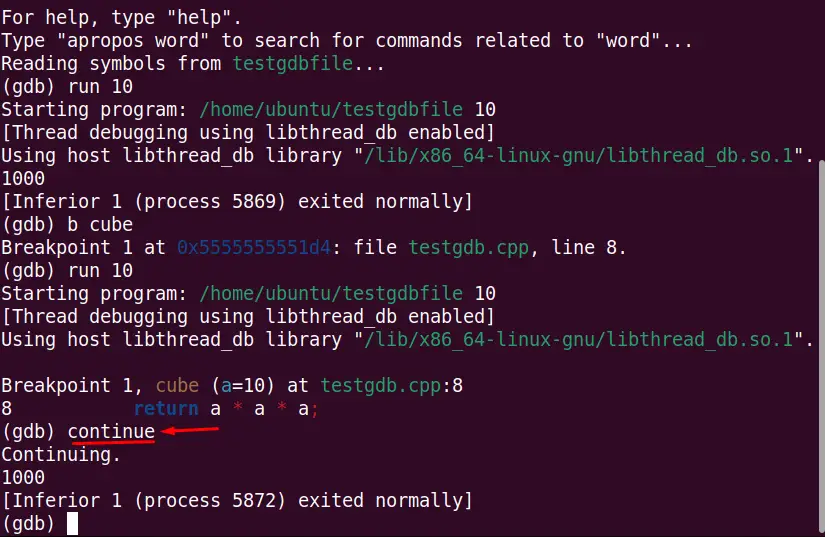
The continue command bypasses breakpoint 1 and executes the program ahead of the breakpoint.
Show the Next Line of Breakpoint
The next command is utilized to display the next execution line after the breakpoint in the GNU debugger. For instance, the below next command shows the one next line after a specific breakpoint:
$ next
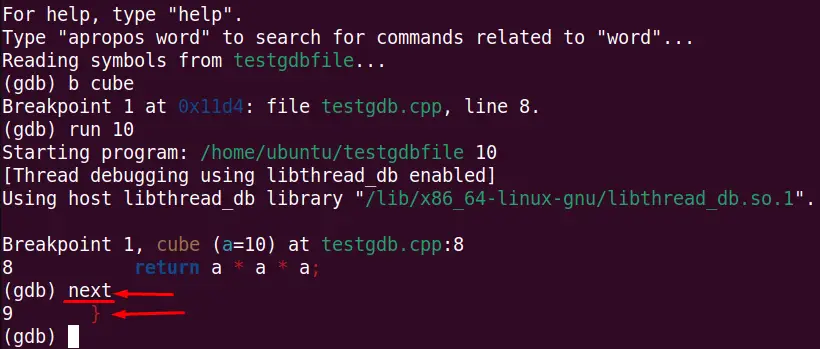
The next line of code is displayed in the GNU debugger after the breakpoint.
Delete the Breakpoint
The delete command is used to delete all the breakpoints or a specific breakpoint. For example, the below commands delete the 1st breakpoint of the program:
Note: The delete command without any number deletes all the breakpoints.
$ delete 1
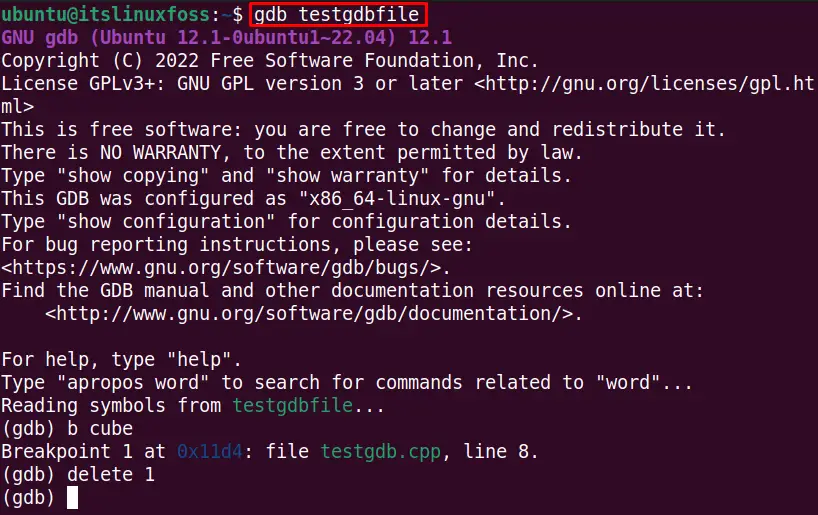
Breakpoint 1 is deleted.
Clear a Breakpoint
We can clear the breakpoint with a function or a line by adding the function number and line number with the clear command. For example, the below clear command deletes the breakpoint before the “cube” function:
$ clear cube
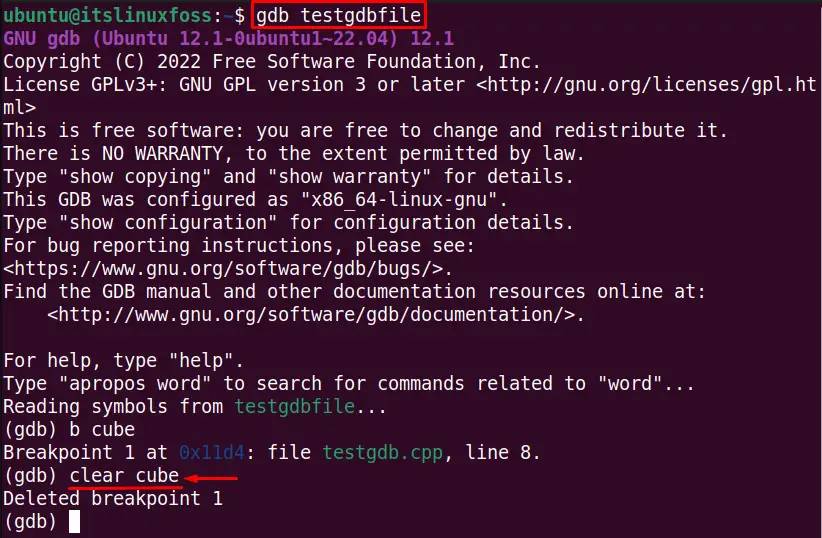
Breakpoint 1 is deleted as seen in the output.
Disable the Specific Breakpoint
The disable command can be used to disable the specific breakpoint number or breakpoint before the function. For instance, the below command deletes the breakpoint number 1:
$ disable 1
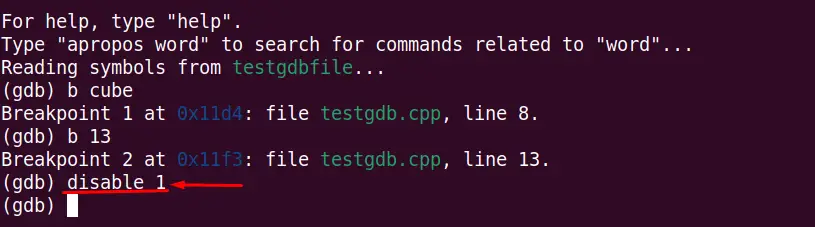
Breakpoint 1 is disabled.
Enable the Breakpoint
The disabled breakpoint can be enabled with the “enable” command. For example, the below command enables the disabled breakpoint 1:
$ enable 1
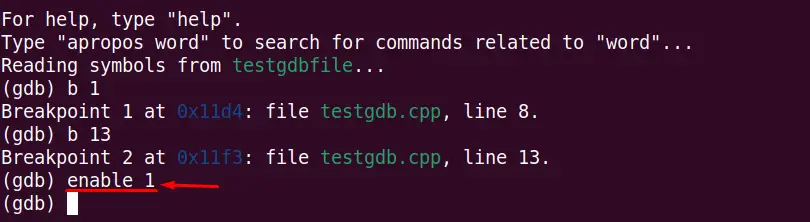
Breakpoint 1 is enabled.
Show the Information
We can check the built-in function names, breakpoints, checkpoints, and other information with the “info” command. For example, the below command shows all the breakpoints:
$ info breakpoints
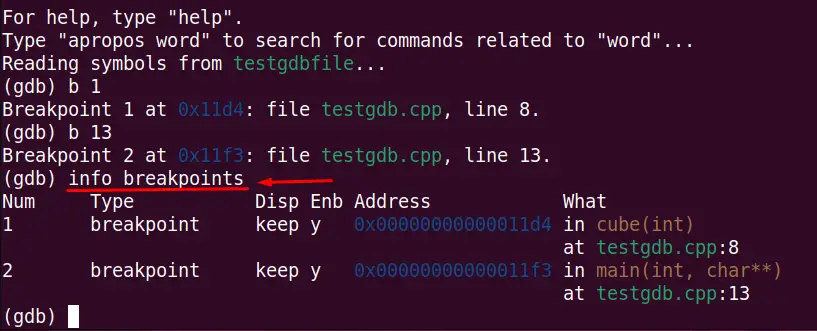
The output displays that two breakpoints are present in the program.
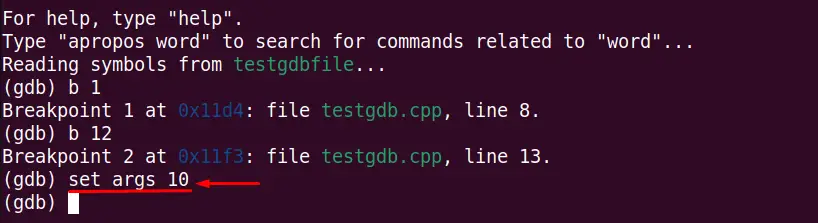
Set the Default Arguments
We can set the built-in arguments to a program with the set args command. For example, the below command sets the default argument “10” if the user does not manually provide the argument:
$ set args 10
Show the Set Arguments
The show args command is used to display the arguments set in the GNU debugger as done below:
$ show args
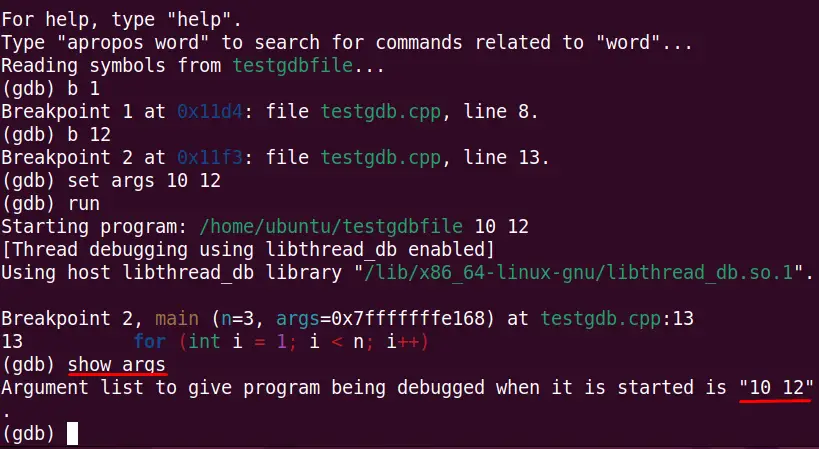
Two arguments, “10 and 12”, are built-in in into the program.
Create a Checkpoint
The checkpoint command is used to suspend the previous program and create a new process for that program. For example, the below command creates the new program in the GNU debugger:
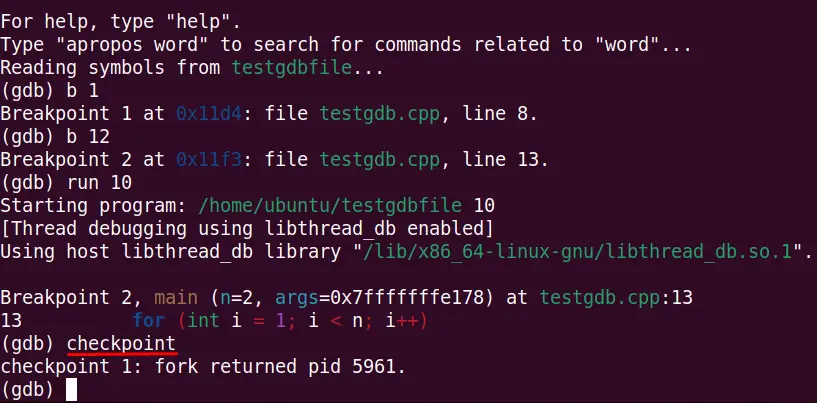
The new program is created, and its Process ID PID is displayed in the output..
Conclusion
This article has provided the cheat sheet and explains the most commonly used GDB commands in Linux, which can perform the specific function in the GNU debugger. Moreover, the GDB commands can be utilized to open, run, add breakpoints, continue, enable, disable, set, and show the arguments.