In Google Docs, the “Venn Diagram” is the key visual representation to draw some comparison between multiple objects/entities. The “Venn Diagrams” helps in identifying the shared area/entities of objects. Venn diagrams describe the similarities, un-similarities, and differences between the concepts. There is no specific tool in Google Docs to draw Venn diagrams. However, it can be obtained through the “Drawing” option in Google Docs.
How to Make a Venn Diagram in Google Docs?
In this method, users will learn to create simple Venn diagrams. Google Docs drawing tool provides the feature to draw any type of shape. Let’s see how a Venn diagram can be created:
Step 1: Open Google Doc
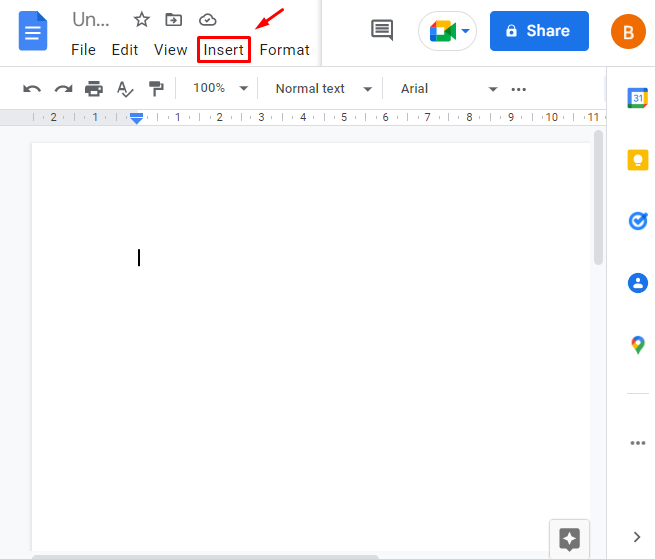
Open your Google Docs and click on the “Insert” from the MenuBar:
Step 2: Open the Drawing Tool
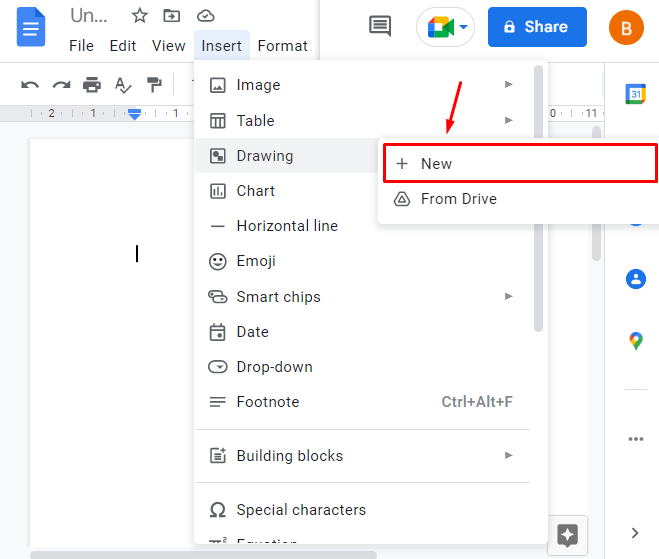
From the dropdown, hover on “Drawing” and click on “New”:
Step 3: Draw Circles
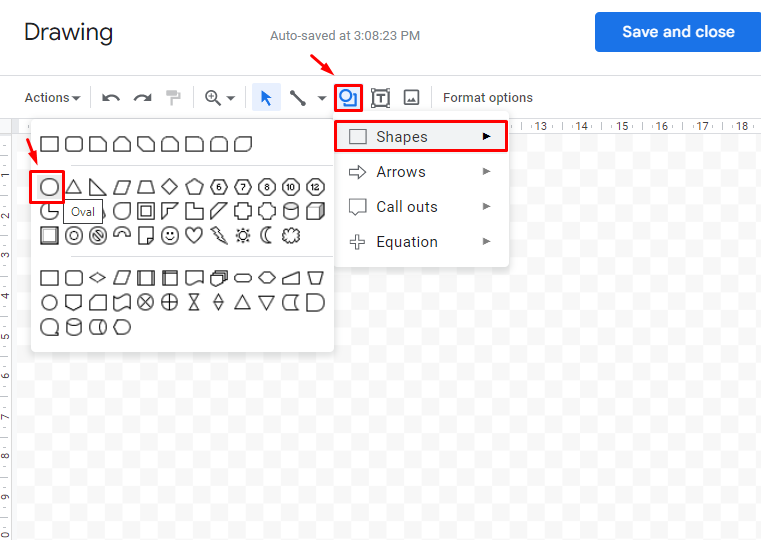
Now, click on the “Shapes” option and draw two circles in your drawing:
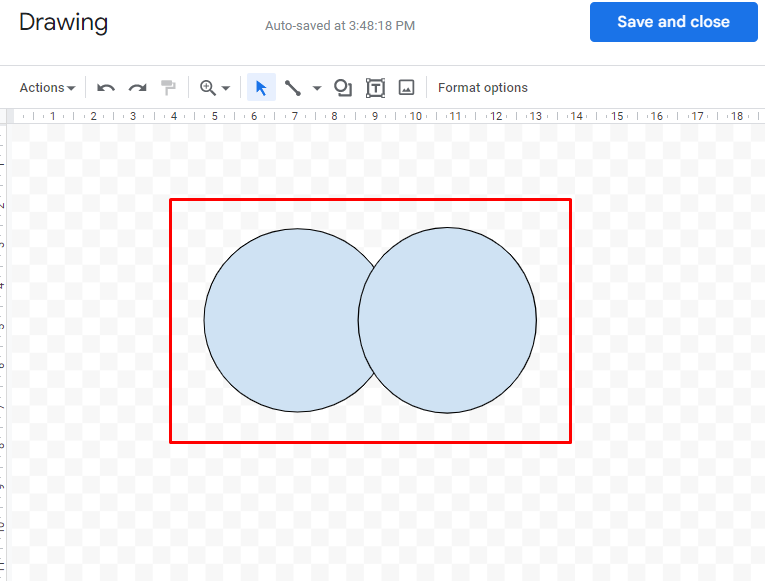
Make two circles in this way that they overlap each other:
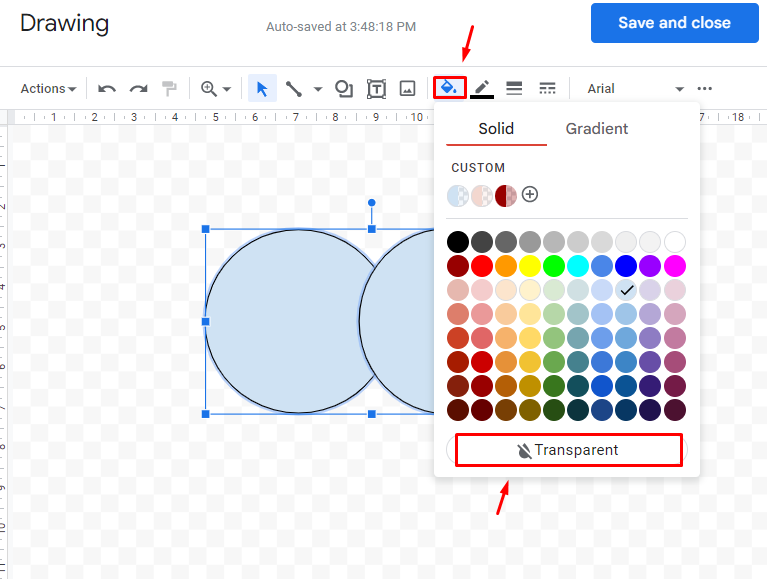
Step 4: Transparent the Circles
Make them transparent by clicking on the color option as shown below in the image:
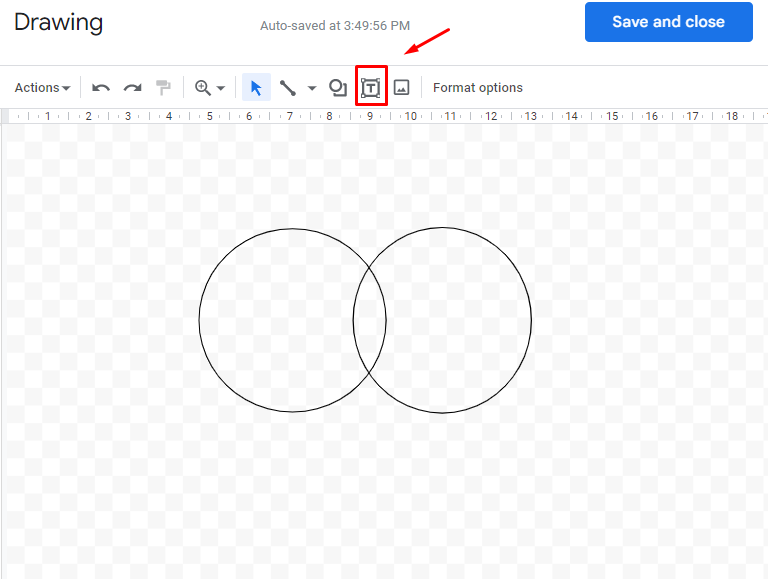
Now, type the text by clicking on the text option available in the toolbar:
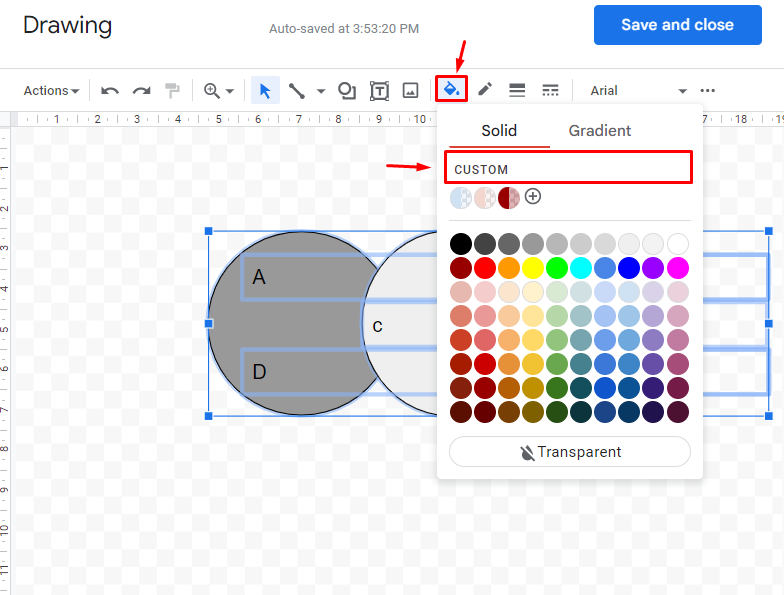
Step 5: Label the Circles
Label them according to the requirement, add some colors in both circles and click on the “CUSTOM” option to adjust transparency:
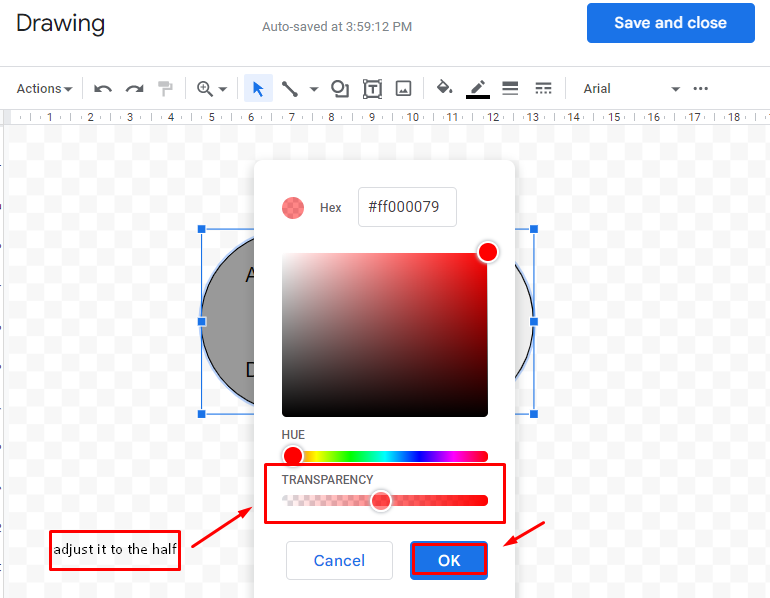
Adjust transparency and click on the “OK” button:
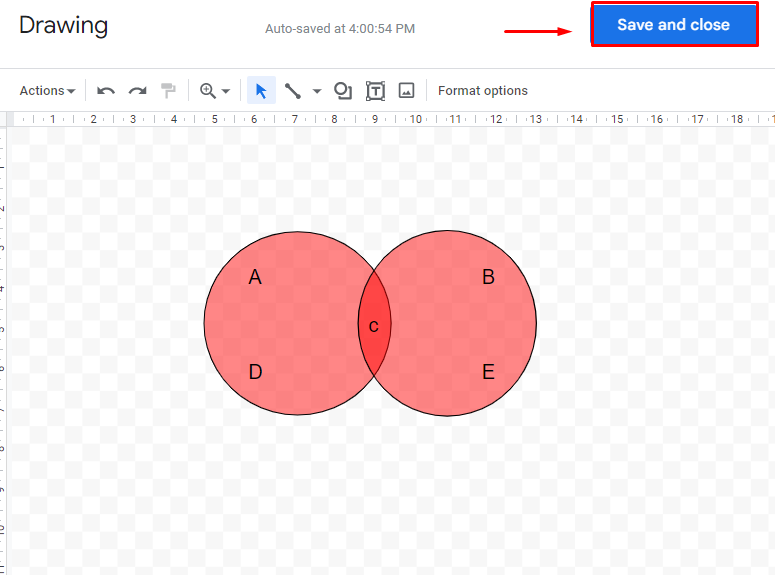
Now, click on the “Save and close” option in the top right corner:
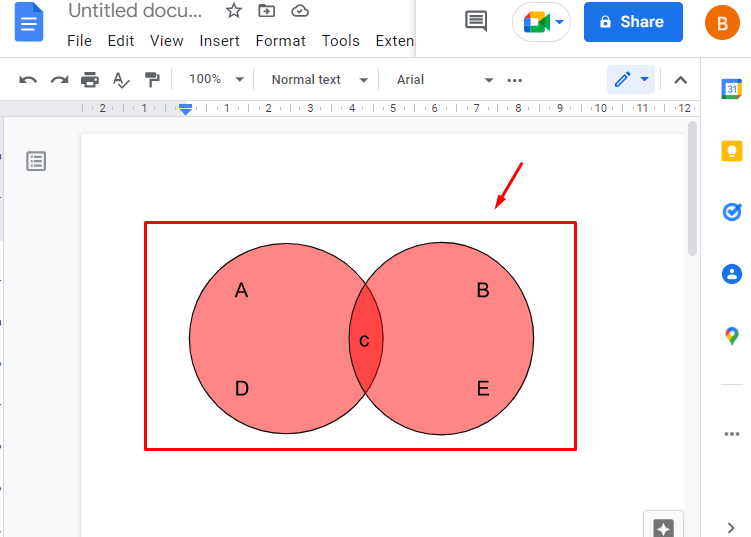
Finally, your Venn Diagram is inserted in the document as shown in the below image:
That’s all from this post!
Conclusion
In Google Docs, the Venn Diagrams can be created using the drawing tool available on the “Insert” tab. The users need to add circles, add effects to those circles, and then label them according to their requirements. This Goggle Docs post has demonstrated a step-by-step procedure to make a Venn diagram.