The iostat command in Linux tracks the CPU usage and the input/output devices for performance analysis. It displays the percentage of the system’s hardware resources being used. The output of the “iostat” command is a detailed report that can be used to check the system’s performance and upgrade its hardware.
The “iostat” command helps you to find the possible bottlenecks in your system. It is a phenomenon in which the system’s components are not working together. If your system has a bottleneck, it could have serious performance issues.
This guide explains the “iostat” command in Linux using the examples.
Content Covered
- How to Install the iostat Command in Linux?
- Understanding the iostat Command in Linux
- How to Use the iostat Command in Linux?
- Alternatives for the iostat Command in Linux
How to Install the iostat Command in Linux?
The “iostat” command comes with the “sysstat” package, which is pre-installed in many distros of Linux. However, if it is not, use the following commands as per the distribution you are using:
sudo apt install sysstat #Ubuntu/Debian
sudo yum install sysstat #Fedora/RedHat/CentOS
sudo pacman -S sysstat #Arch Linux
Understanding the iostat Command in Linux
As discussed earlier, the “iostat” command is employed to view the system’s performance by analyzing the system’s hardware usage. Let’s take a look at its syntax.
Syntax
iostat [options] [<interval>] [<count>]
Here,
- The “options” are the flags allowing the users to view the output per their requirements.
- The “interval” allows the users to specify the time (in seconds) before the next report is displayed.
- The “count” lets the users specify the count before the command exits.
For effective analysis, the “iostat” offers several flags/options, as explained below:
| Option/Flag | Description |
|---|---|
| -c | Use this option to view only the CPU usage report. |
| -d | Use this option to view only the device utilization report. |
| -h | This option displays the output in an easy-to-read format. It shows the output in kilobytes (KBs) and megabytes (MBs) |
| -k | Use this option to view the output in Kilobytes of KBs. |
| -m | Use this option for viewing the output in Megabytes or MBs. |
| -N | Use this option to view the registered device mapper names. |
| -s | Use this option to reduce the width of the output report. |
| -t | Use this option to print the time with each report that is displayed. |
| -V | Use this option to view the version of the “iostat” & the copyright information of the “iostat” command. |
| -x | This option makes the “iostat” display the detailed statistics. |
| -y | Use this command to omit the first report since the system boot. |
| -z | Use this command to omit the output in which no activity was recorded during the sample period. |
How to Use the iostat Command in Linux?
Let’s dig deeper into the “iostat” command via the following examples:
Example 1: View System’s Resource Usage Using the iostat Command in Linux
Run the “iostat” command with no flags/options to view the system’s resource usage:
iostat
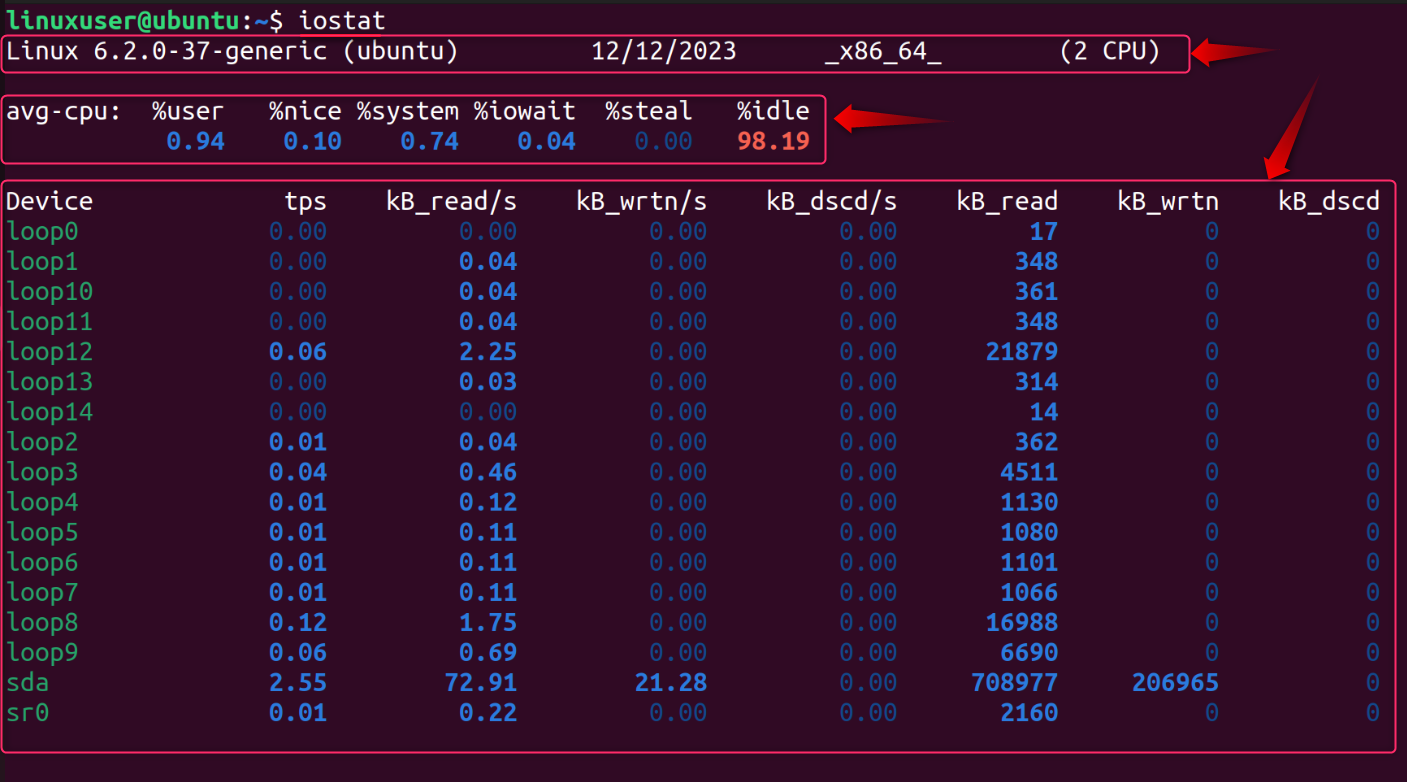
In the above output snippet, the following terms are displayed:
First, the operating system details are shown, which in this case is Ubuntu. Here, we can also see the date, the system’s architecture, and the number of CPUs.
Next, it shows the average CPU resource usage (avg-cpu), and here,
- The “%user” represents the CPU usage of the current user’s applications.
- The “%nice” represents the CPU usage of the current user’s applications but with nice priority. The process’s priority is determined by the nice value.
- The “%system” represents the CPU usage of the system or Linux Kernel.
- The “iowait” represents the time the CPU (to perform a task) had to wait for the I/O operations to finish.
- The “%steal” represents the time the CPU(s) had to wait while the hypervisor was busy with another virtual processor.
- The “%idle” represents the time the CPU(s) were idle and there was no I/O request to process.
After that comes the “Device Utilization Report”, which illustrates the % of the devices or physical partitions used. Here,
- The “Device” is the name of the partition or the system’s drive.
- The “tps” or “transfers per second” column displays the number of “tps” issued to the partition or drive.
- The “kB_read/s” represents the number of reads (blocks)/second from the device or partition. It can be in KBs or MBs.
- The “kB_wrtn/s” represents the number of writes (blocks) per second to the device or partition. It can be in KBs or MBs.
- The “kB_dscd/s” is the number of discards (blocks) per second from the CPU. It is the discarded data.
- The “kB_read” is the total data read from the device or partition.
- The “kB_wrtn” is the total data written to the device or partition.
- The “kB_dscd” is the total data that is discarded by the CPU.
Example 2: View CPU Usage Report Using the iostat Command in Linux
The “-c” flag of the “iostat” command displays the CPU usage report on the Linux terminal. It is illustrated as follows:
iostat -c
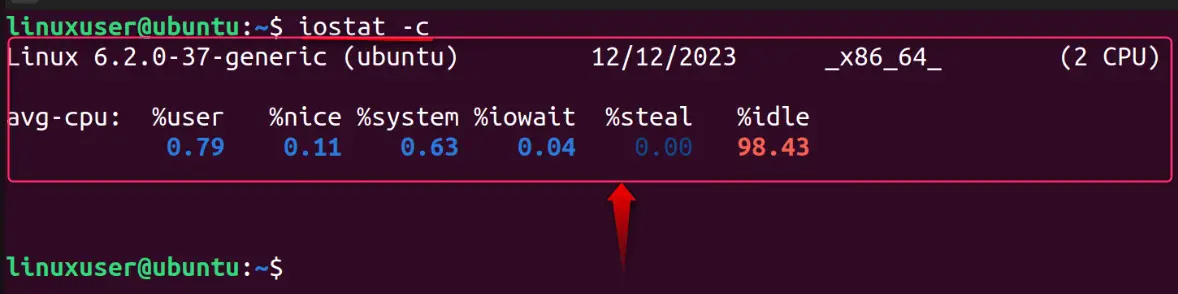
The above command prints the average percentage of the CPU’s use from the boot time to the current time.
Example 3: View CPU Usage Report for Specific Time Using the iostat Command in Linux
To view the CPU usage report after a specific time (let’s say after every 3 seconds), use this ‘iostat” with the “-c” flag and specify the time:
iostat -c 3
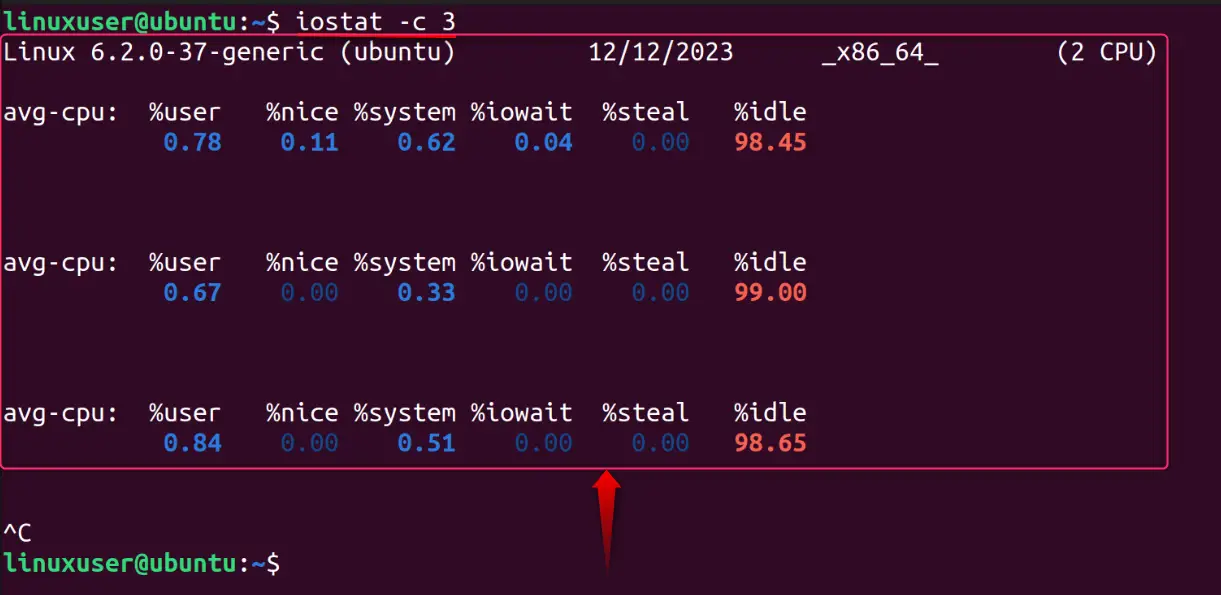
The above command displays the CPU’s resource usage after every 3 seconds. Users must use the “CTRL/Control + C” keys to stop the command.
Example 4: View Device Usage Report Using the iostat Command in Linux
Use the “-d” flag of the “iostat” command to view the device utilization statistics. It is illustrated as follows:
iostat -d
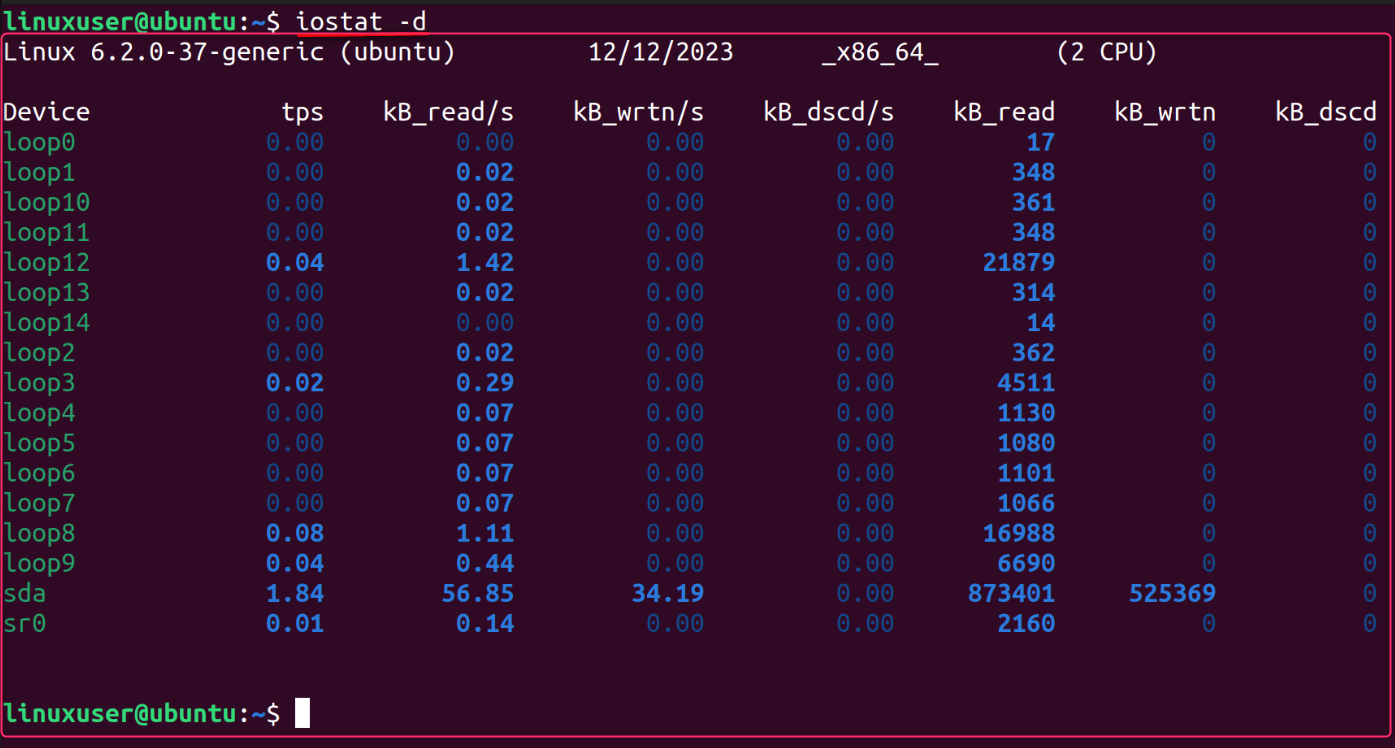
The above command displays the device/disk usage. The kB_read, kB_wrtn, and kB_dscd represent the data being read, written, or discarded once the system is booted.
Example 5: View Device Usage Report for Specific Time Using the iostat Command in Linux
To view the device/disk usage report after a specific time (suppose after every 5 seconds), use the “-d” flag of the “iostat” command as below:
iostat -d 5
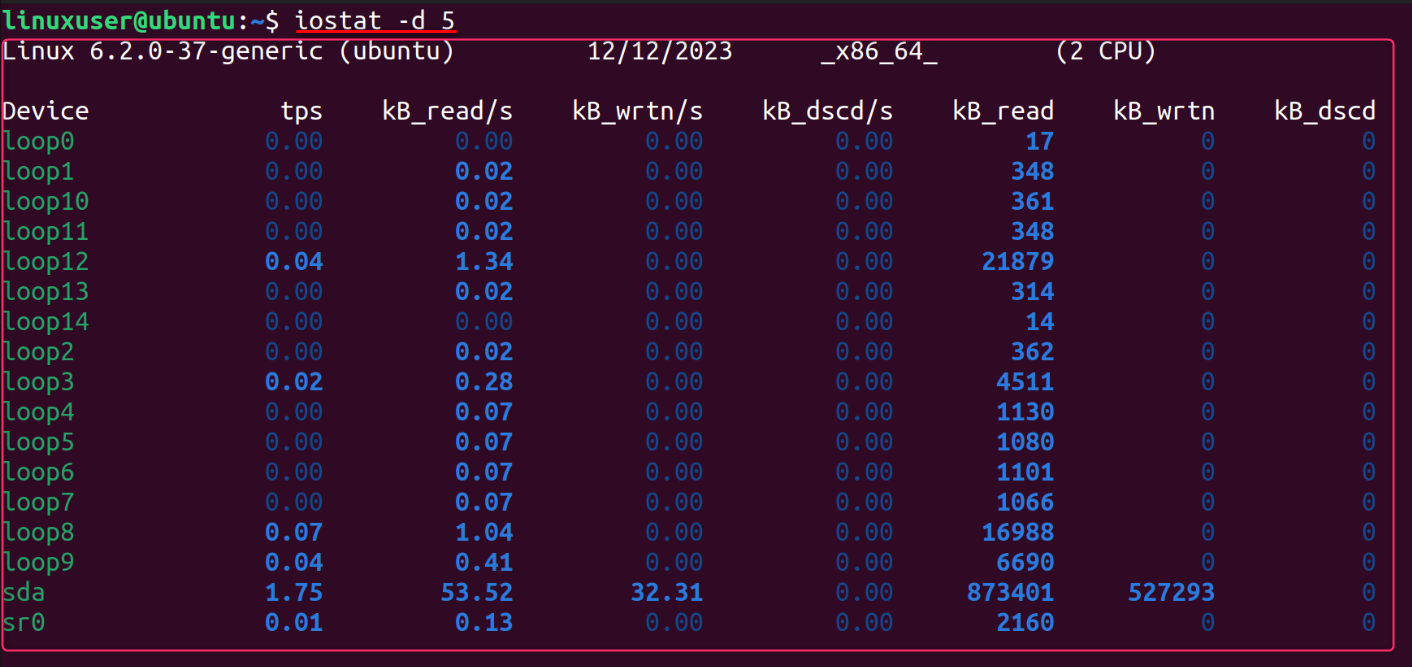 The above command displays the device/disk usage after every 5 seconds. Use the “CTRL/Control + C” keys to stop it.
Example 6: View CPU/Device Usage Report in a Human-Readable Form Using the iostat Command in Linux
The “-h” flag of the “iostat” command in Linux views the results in a more human-readable form. The report displays the data either in KBs or MBs. If a user wants to view the data in KBs, the “-k” must be used:
iostat -h -k
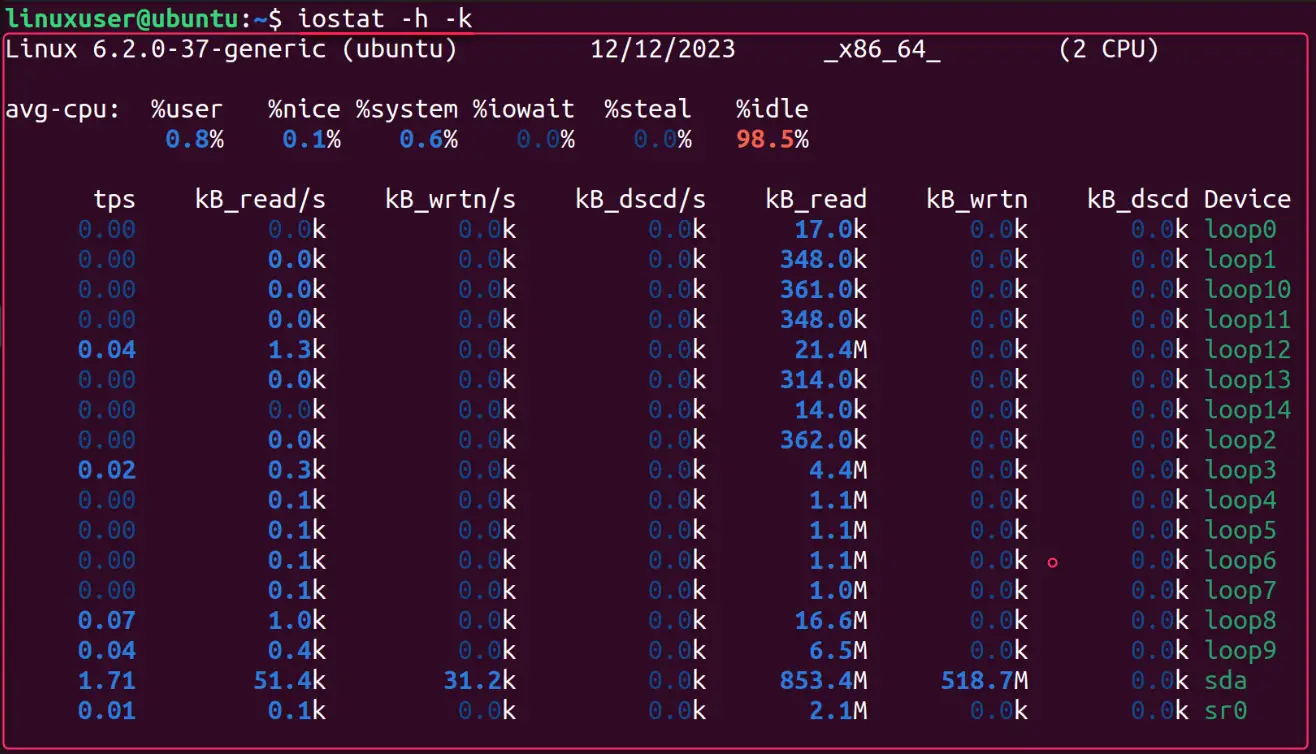
The above command displays the data in KBs. Use the “-m” for MBs.
Example 7: View the System’s Resource Usage With Reduced Width Using the iostat Command in Linux
The “-s” flag of the “iostat” command in Linux allows you to view the output with reduced width. It enhances readability and is used as follows:
iostat -s
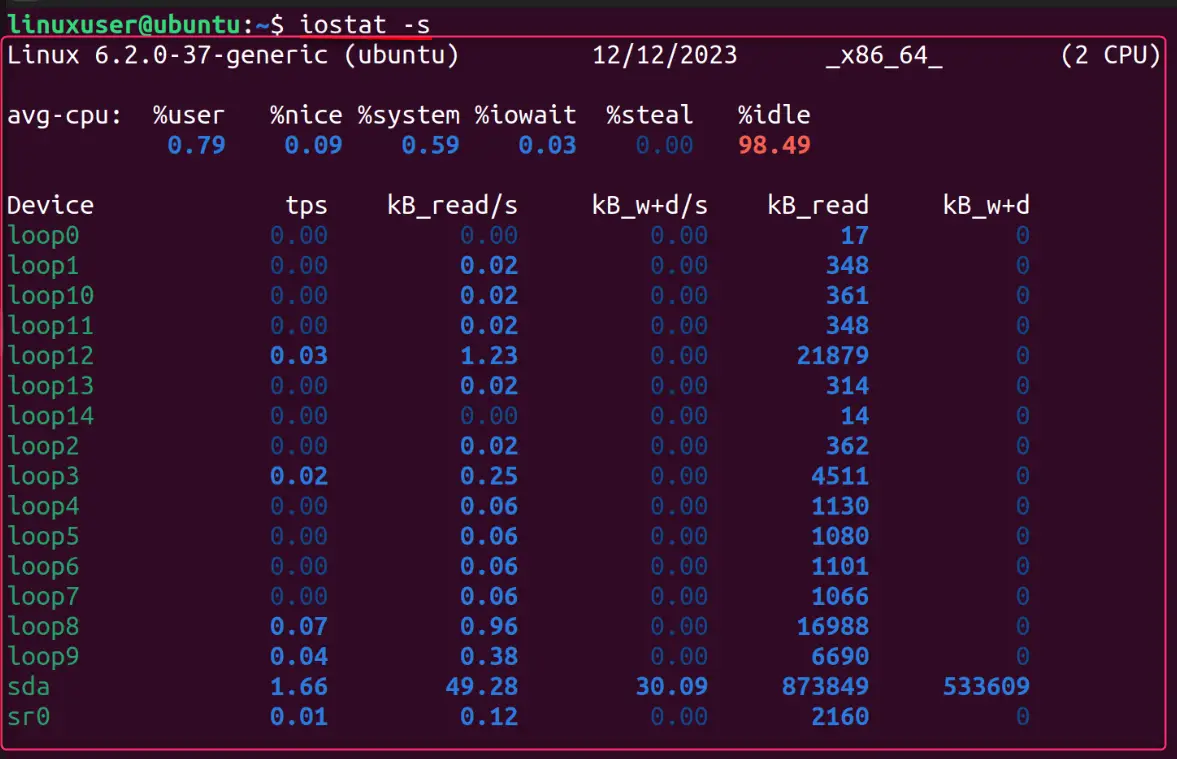
The above command displays the data with reduced width but combines the relevant columns. For instance, the “kB_w+d/s” combines the “kB_wrtn” and “kB_dscd” columns into one.
Example 8: View System’s Resource With Time Using the iostat Command in Linux
Use the “-t” flag of the “iostat” command in Linux to analyze the system’s resources per time:
iostat -t
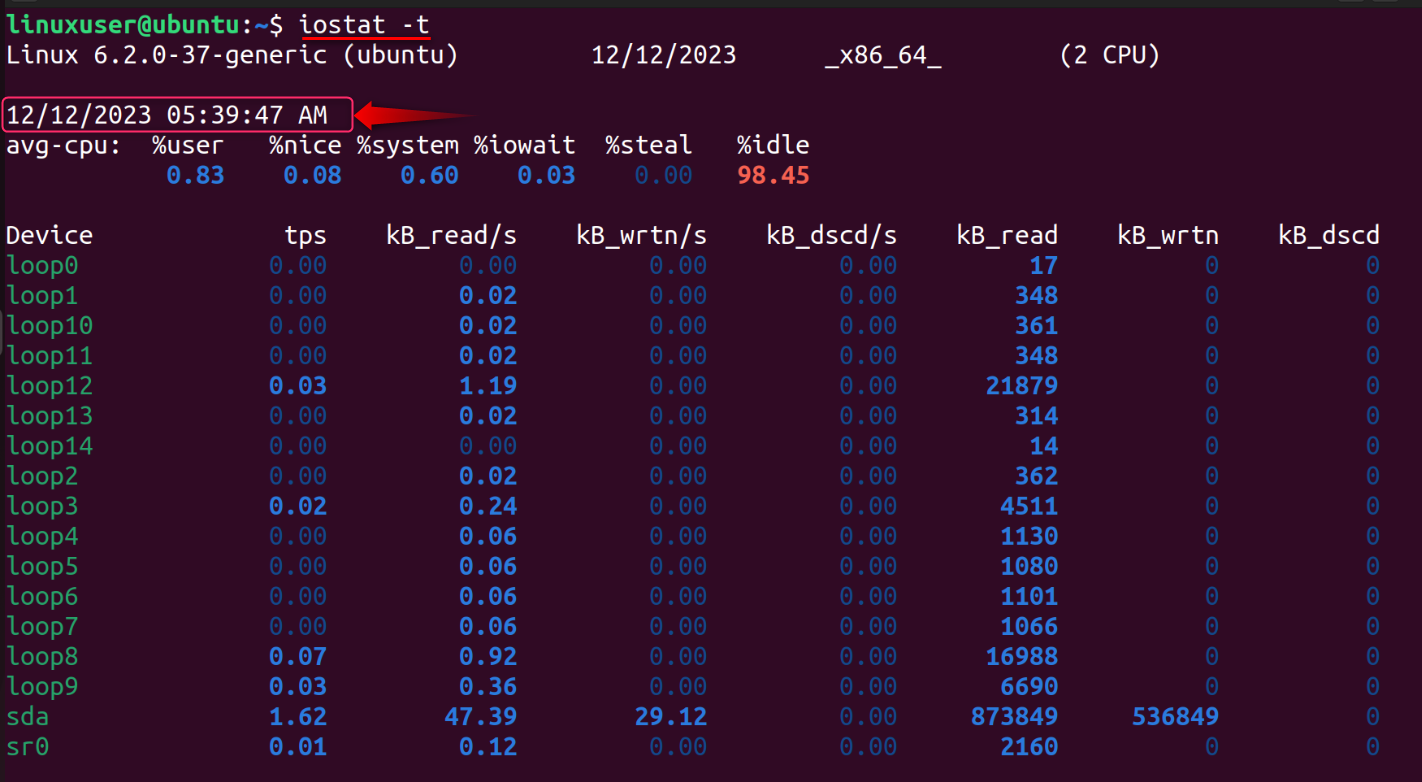
As seen in the above snippet, the “iostat” command has also displayed the date & time on which the data was collected.
Example 9: View the Version Information of the iostat Command in Linux
To view the currently installed version of the “iostat” command, use the “-V” flag, as seen below:
iostat -V
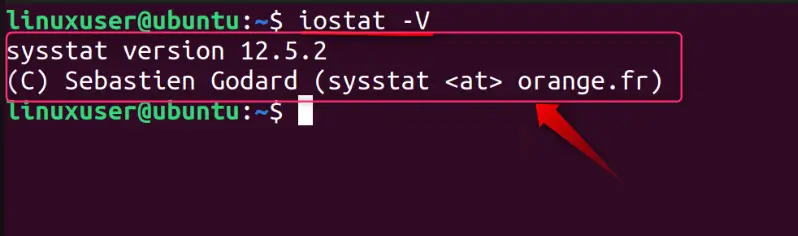
The above snippet displays the version (12.5.2 in this case) and copyright information of the “iostat” command in Linux.
Example 10: View Extended System Performance Statistics
For expert users or tech enthusiasts, the “iostat” command of Linux can display extended device/disk performance or usage statistics (using the -x flag). To view a detailed report of your device/disk’s performance statistics, use the “-x” flag as follows:
iostat -x
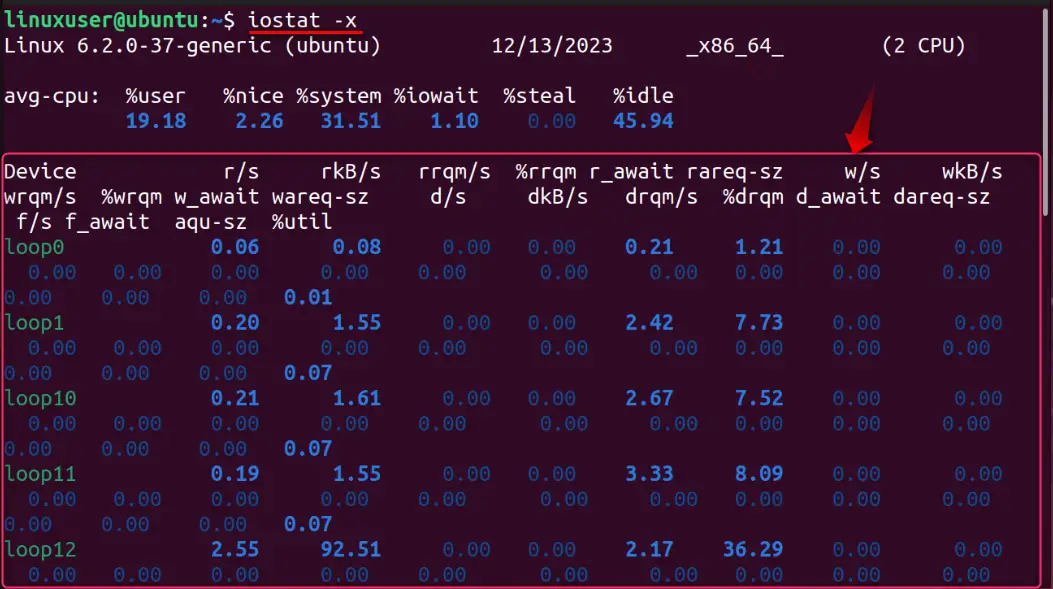
In the above output, we have additional information about the system’s resource usage:
- “r/s” shows the number of read requests per second.
- “rkB/s” displays the number of blocks KBs or MBs that are read from the device.
- “rrqm/s” enlists the total number of read requests queued merged/second to a specific device. A merge is a process of combining two requests to form a longer-length request.
- “%rrqm/s” represents the percentage of the read requests merged before they are sent to the device.
- “r_await” is the average time for the input or output requests to the device. It is in milliseconds.
- “rareq-sz” is the size (average) of the read requests directed to the device.
- “w/s” represents the number of write requests/second.
- “wkB/s” displays the number of blocks KBs or MBs that are written to a specific device.
- “wrqm/s” shows the number of write requests queued merged/second to the device.
“%rrqm/s” enlists the percentage of the read requests merged after which, they are sent to a specific device.
- “w_await” is when the write requests were placed in the queue and the time they were processed. It is in milliseconds.
- “d/s” is the data read per second from the device.
- “dkB/s” is the data read per second from the device in kilobytes (KBs).
- “drqm/s” enlists the total number of discarded requests queued merged/second to the device.
- “%drqm/s” is the percentage of the discarded requests queued merged/second before which, these requests are sent to a specific device.
- The “d_await” represents the time spent by the discarded requests in the queue and the time taken to process them by the device. It is in milliseconds.
- The “dareq-sz” is the average size of the discarded requests sent to the device.
Example 11: View the Output of the iostat Command in JSON Format
For effective sharing of data, especially through web API, the JSON format is used. The “iostat” command can output the report in several formats, including JSON. To generate a system performance report using the “iostat” to JSON in Linux, use this command:
iostat -o JSON
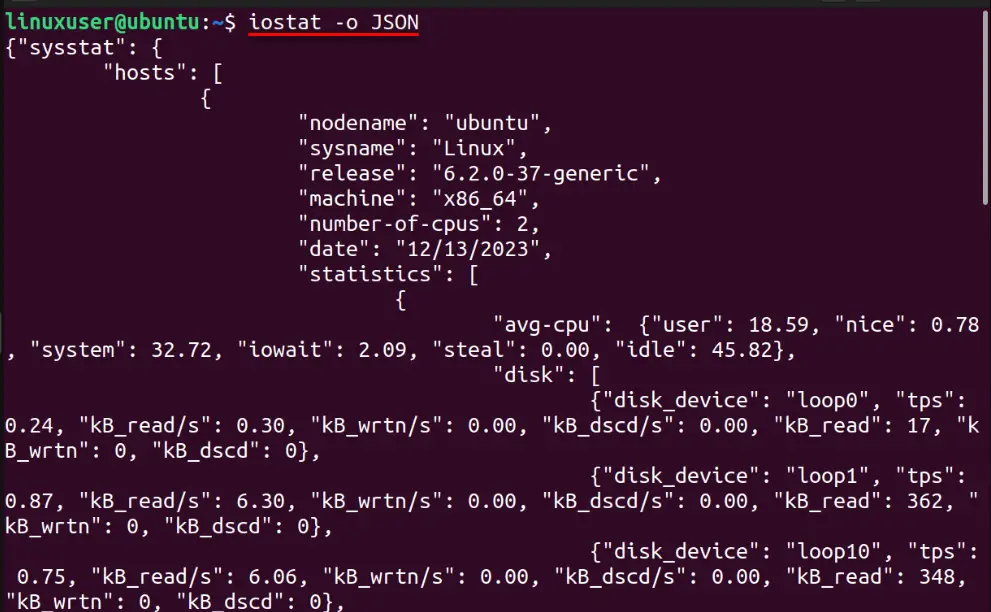
In the above command, the “-o JSON” outputs the “iostat” command’s report in the JSON format.
Example 12: View the Performance Statistics of a Specific Disk Using the iostat Command in Linux
Use the “-p” flag followed by the device’s name to print the performance report of that device. Let’s take the “sda1” as an example:
iostat -p sda1
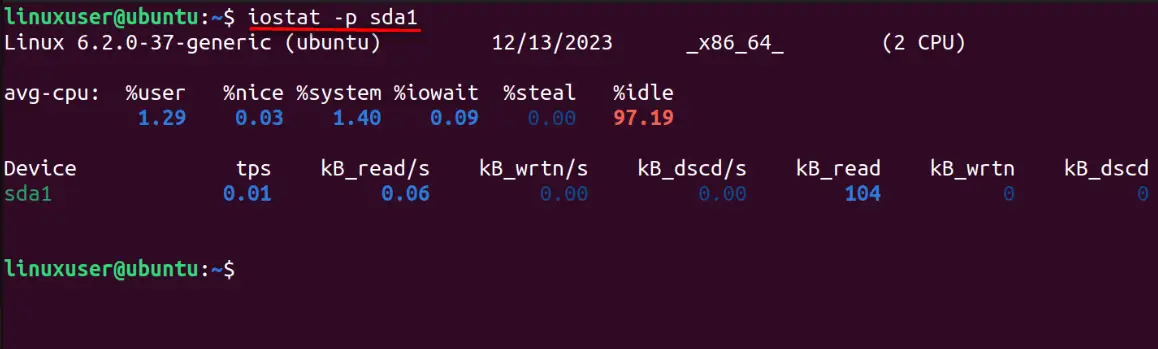
The above snippet shows the performance report of the “sda1”.
Alternatives for the iostat Command in Linux
A few users may not be satisfied with the “iostat” command, so we bring a few alternatives.
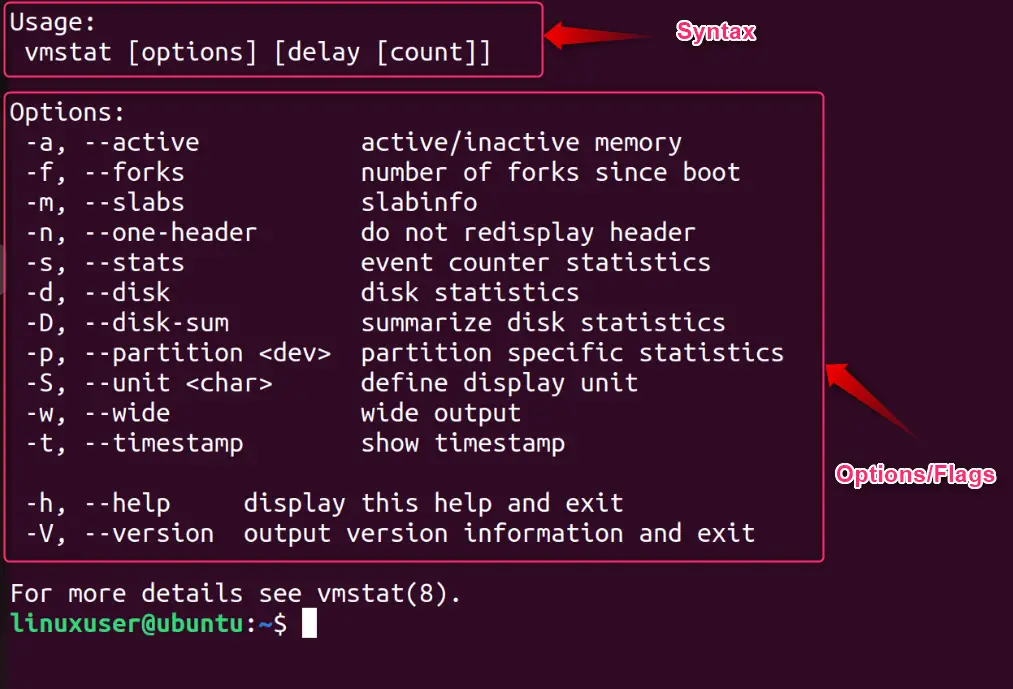
- The vmstat Command
The vmstat is a utility that comes with the “sysstat” package of Linux and is pre-installed. Unlike the “iostat” command, the vmstat command views the statistics about the system’s processes, I/O, CPU, and memory performance. It also includes several options/flags, such as the ones below to modify the output as per the requirements:
- The htop Command
The htop command in Linux is a real-time system monitoring command-line utility in Linux. It displays the CPU, swap, memory usage and processes in a GUI-like environment. It includes several options for a customized output, as seen below:
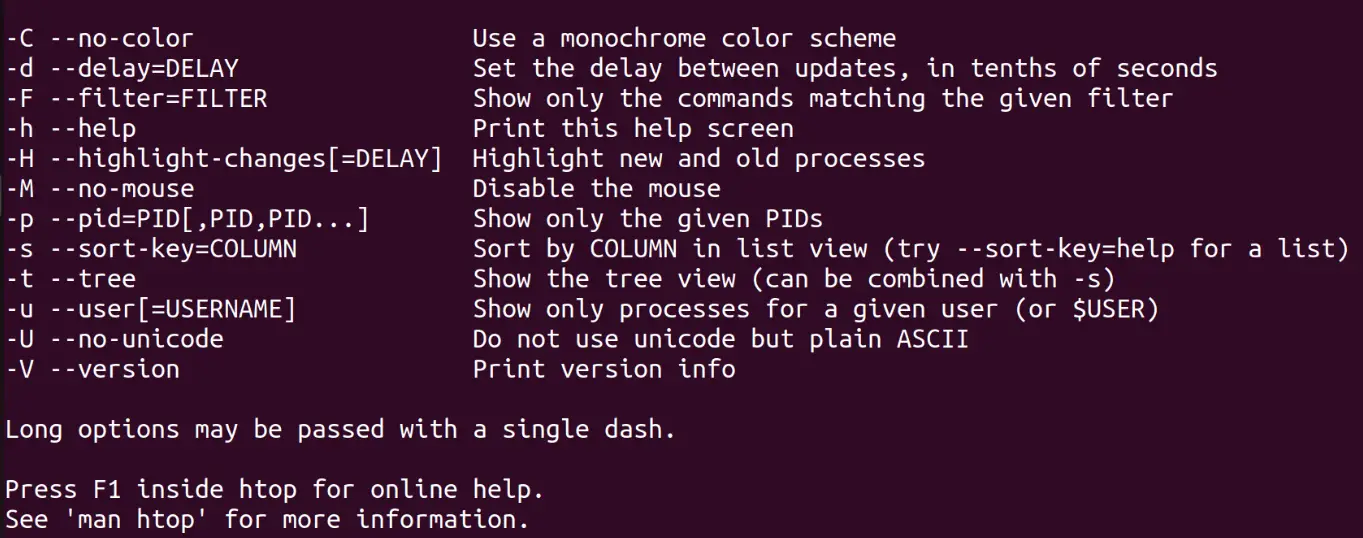
Read: How to Use the htop Command in Linux.
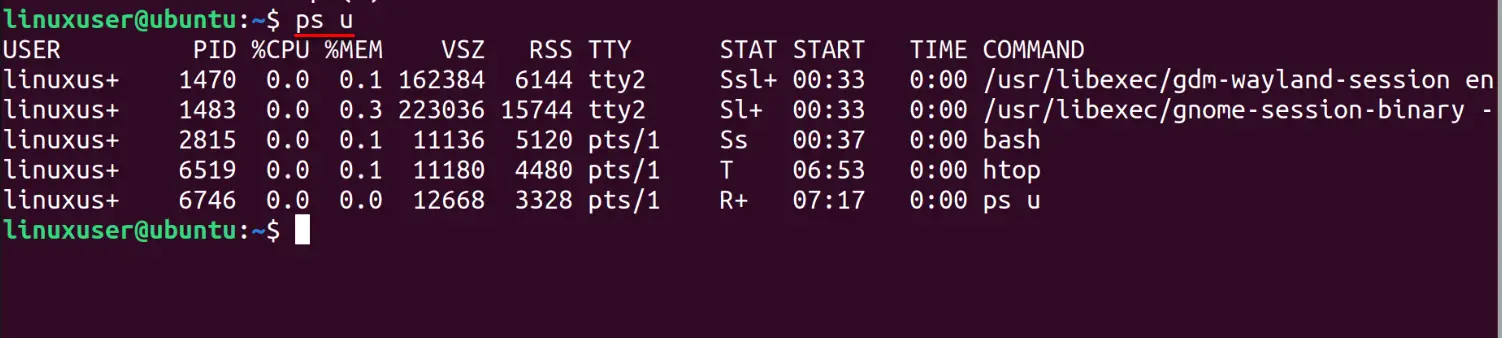
- The ps Command
The “ps” or “Process Status” command of Linux is a basic utility that lets you view the currently running processes, CPU & memory usage (in %), and much more. To get information about the CPU & memory usage, use the “u” with the ps command, as seen below:
ps u
Read: ps Command in Linux | Explained
That’s all for the “iostat” command of Linux.
Conclusion
The “iostat” command of Linux enables the users to check the system’s resource usage. It includes flags like “-c” to view the CPU utilization report, “-d” to view the device/drive, and many others, as explained above. The “iostat” command can display the resource usage report in real time after the user-specified time. If users are unsatisfied with the “iostat” command, they can use the vmstat, htop, or ps command-line utilities.