The load average calculates the process’s number either running on the computer’s CPU or ready to be run. Ideally, the load on the CPU is 0 if no processes are being run on the system. Different processes in Linux engage the CPU for their performance. There are different loads, among which is the Load Average.
This blog’s different sections will help readers understand the Load Average on Linux:
- What is the Load Average on Linux?
- Method to Check the Load Average on Linux
- Using the uptime Command
- Using the top Command
- Using the glances tool
- Load Average on Single Core Process
What is the Load Average on Linux?
Another terminology for the Load Average is the Average System Load which shows the number of processes running on the CPU. There are two types of loads in Linux:
- Load Average: It is the average load on the CPU, which is calculated after 1, 5, and 15 minutes
- System Load: It is the total amount of the load that is either running on the computer or is in the queue of being executed
In the next section, we will find the methods for finding the load average on Linux.
What is the Method to Check the Load Average on Linux?
There are three different methods of checking the Load Average on Linux:
- Using the uptime command
- Using the top command
- Using the glances tool
All these methods are explained in detail.
Method 1: Using the uptime Command
The first method of checking the load average on Linux is by using the uptime command:
$ uptime

In the output, we can see that the “load average” has been displayed.
The load average is displayed for the past one minute, five minutes, and fifteen minutes and in our case, the average load for one minute is 0.57; for five minutes, it is 0.78; and for fifteen minutes, it is 0.40.
Method 2: Using the top Command
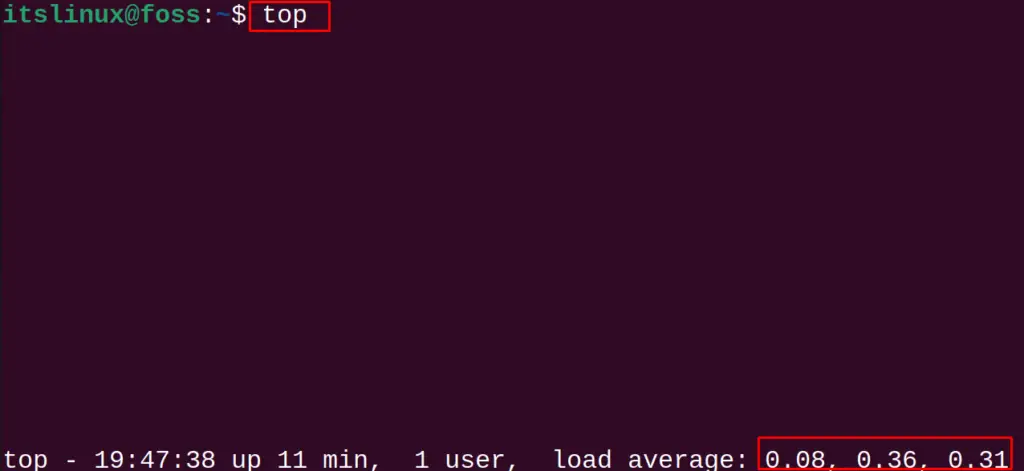
Another method of calculating the load average is by using the top command:
$ top

Similar to the output of the uptime command, the load average is displayed in the output of the top command. The output of the top command shows that the load average for the past minute is 0.08; for five minutes, it is 0.36; and for fifteen minutes, it is 0.31.
Method 3: Using the glances tool
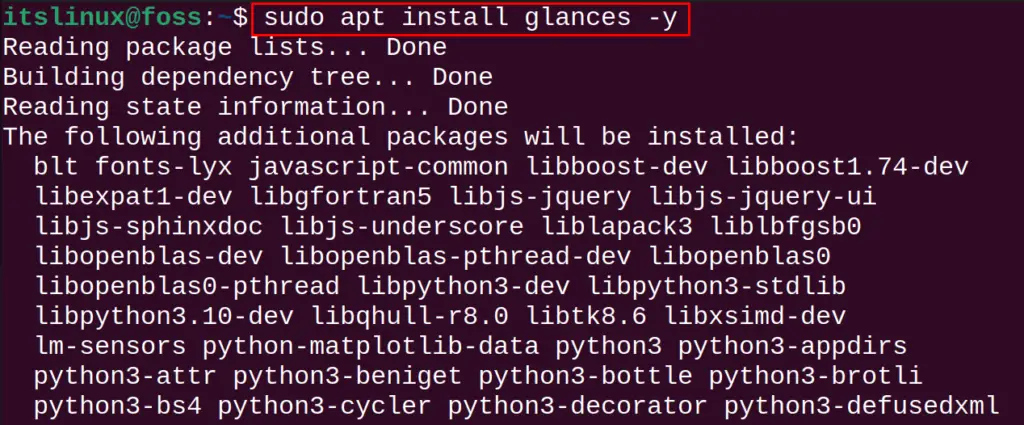
Last method of finding the load average on Linux is by using the glances tool. The glances tool can be installed on Linux using the command:
$ sudo apt install glances -y   #Debian/Ubuntu
$ sudo yum install glances     #CentOS
$ sudo dnf install glances       #Fedora

After installing the glances, use the glances command to display the load average:
$ glances

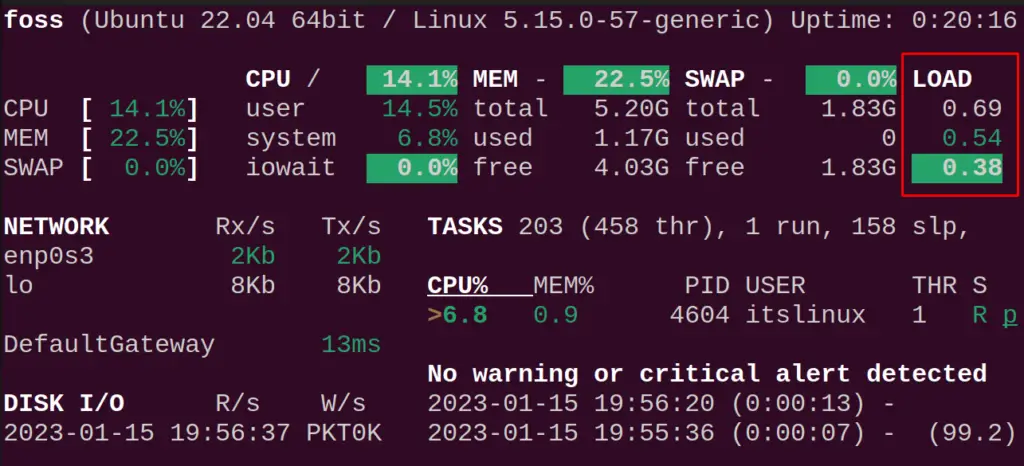
When the command is executed, the below-mentioned output can be seen:

We can see the Load average on the computer is 0.69, 0.54, and 0.38 for the past one, five, and fifteen minutes respectively.
Load Average on Single Core Process
In Linux, the load average refers to the load on the processing units. To understand the output of the Load Average, first, get the number of processing units offered by your processor (to accommodate the current processes):
$ nproc

Now, recall the output of the load average from any of the above methods:

According to the above output of load average:
- The processor is engaged with 57% of processes for over one minute.
- 78% of processes are in the queue for over the last five minutes to be run.
- 40% of the processes are in the queue for over the last fifteen minutes to be run.
If the number of processors is more than one, then this load will be divided among the number of processors.
Conclusion
Load average is the measure to determine the processes running or waiting to be run on the CPU. Three command line utilities, i.e., uptime, top, and glances, can be used to check the load average. methods can find the load average, i.e., uptime, top, and glances. This post briefly explained the load average and the commands to check the load average on a Linux system.
