The journalctl command allows users to view, filter, and analyze the log data recorded by the systemd journal. It can be used to view the entire journal, view journal entries for a specific time, filter them by unit or system service, and display information about journal files.
The journal records log data in a binary format, allowing faster searching and filtering than text-based logs.
This article will elaborate on the details of the journalctl command in Linux with the following outcomes:
- journalctl Command in Linux
- Viewing the Entire Journal Entries
- Display the Information in Reverse Order
- Displaying only a Few Entries
- Display the Priority Messages
- List Boot Entries
How to Use the journalctl Command in Linux?
The journalctl command can be used in various ways depending on the end goal you want to achieve. Still, its basic syntax is mentioned below:
$ journalctl [Options…] [Matches…]
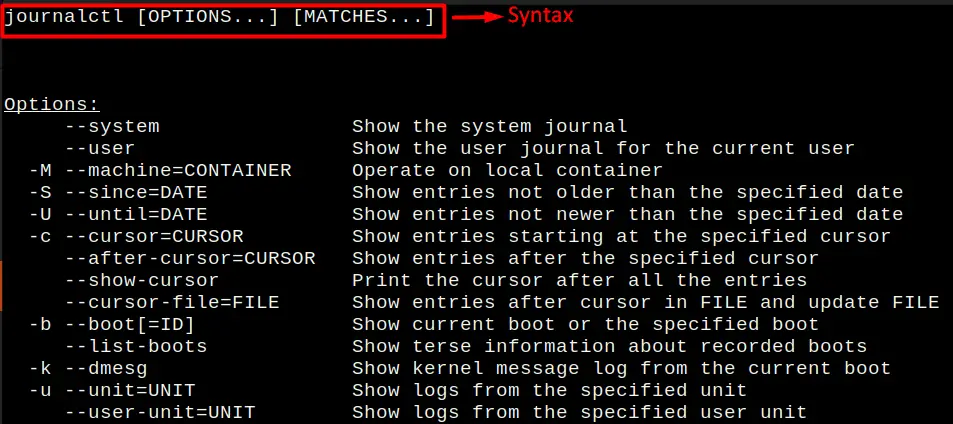
The journalctl command comes with different options, which will show you different results depending on the one that you are using. Whereas the “MATCHES” argument is used to filter the journal output based on specific criteria. Matches can filter journal entries by unit, process ID, syslog priority, and many other fields.
Example 1: Viewing the Entire Journal Entries
The “Entire Journal” in the context of the journalctl command refers to all the log data recorded by the systemd journal. This log data includes information such as system start-up and shut-down messages, messages from system services, and diagnostic information.
So, you can run the following command to view the entire journal information mentioned below:
$ journalctl
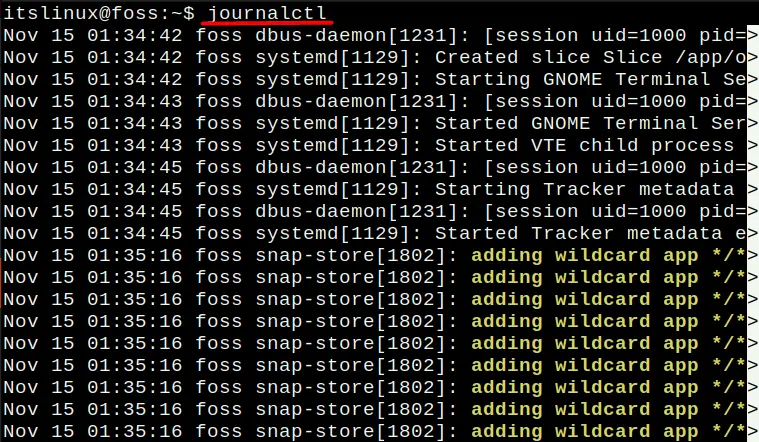
The above image displays the data from “Nov 15” because I installed this operating system on this date. The remaining information can be seen by scrolling down, where it will display all the information in ascending order.
Example 2: Display the Information in Reverse Order
To view all the information in reverse or descending order, you can use the ‘-r‘ option along with the journalctl command as shown below:
$ journalctl -r
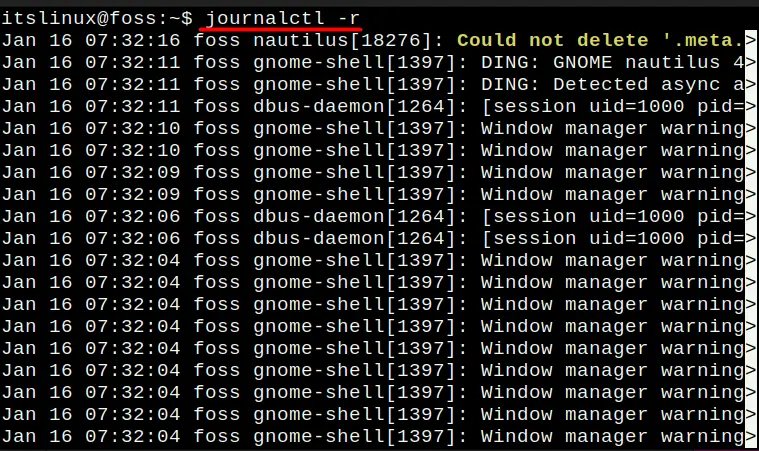
You can see in the above image that now it is displaying information from “Jan 16” which is the current date while writing this article.
Example 3: Displaying Few Entries
The “-n” option and the journalctl command will only show you the specific number of entries you mention. For example, if you only want to show the last 10 entries, then you can do that by typing the below command:
$ journalctl -n 10
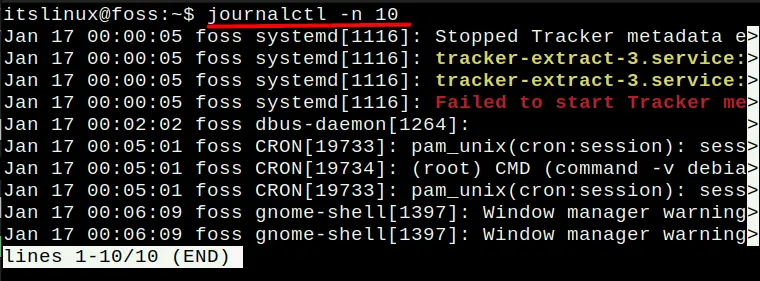
You can see in the above image that it is now showing you the 10 entries only.
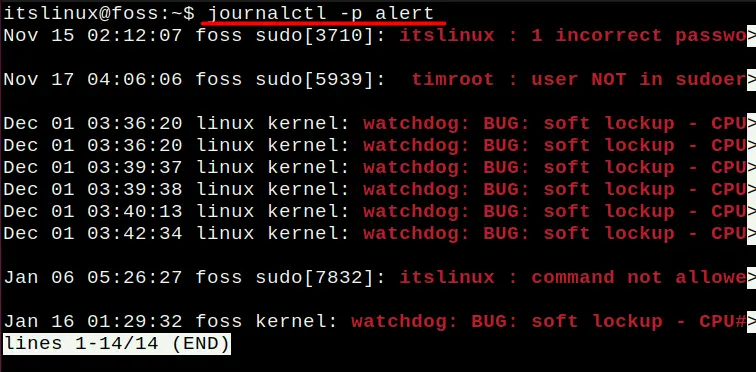
Example 4: Display the Priority Messages
There are different types of priority messages available in the journalctl command, and some of them are emergency, error, alert and critical. So, you can access any of these by using the “-p” option along with any priority messages that you want to see as shown below:
$ journalctl -p alert
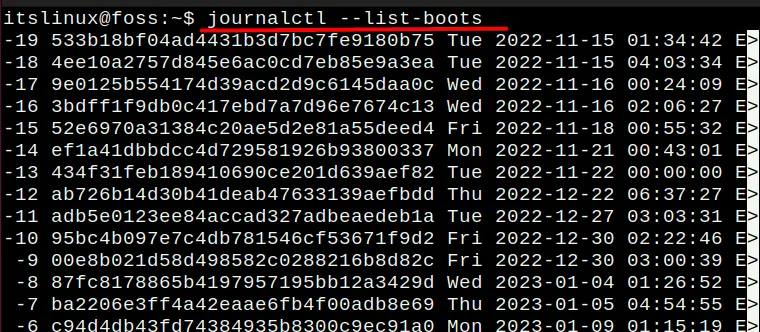
Example 5: List Boot Entries
The “boot entries” refer to the individual instances of the system booting up and each time a computer is powered on or rebooted, a new boot entry is created and logged in the system journal. These boot entries are identified by a unique “boot ID,” a string of characters representing that specific boot instance.
The boot entries can be checked by typing the following command in the terminal:
$ journalctl --list-boots
Conclusion
A journalctl command is a powerful tool for managing and analyzing system logs on Linux. It allows you to view, filter, and analyze the log data recorded by the systemd journal. One of the key benefits of using journalctl is that it offers more efficient management of log data, as it records log data in a binary format for faster searching and filtering. The usage of the journalctl command has been discussed in detail in this article, along with different options associated with it.