
In today’s world of ruthless corporate rivalry, it’s critical that we learn how to make the most of what we have. Waste of hardware or software resources, or a lack of understanding on how to use them more effectively, is a loss we simply cannot afford if we want to be at the top of our game. For such purpose There are several tools available to help you audit the performance of your Linux system and one of them is the perf utility.
Perf is a lightweight CPU profiling command-line utility that monitors program events and examines CPU performance. The perf command may record CPU performance counters and trace points and is used as a major interface to the Linux kernel’s performance monitoring features. It can generate performance metrics from a set of performance counters and inject short scripts (BPF scripts) into the kernel to process the data in real time. In this article we will how you can use the perf command for Linux OS for your own benefit.
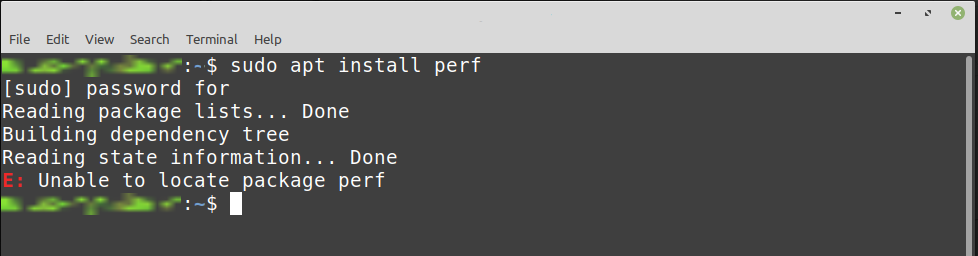
You can install the perf package directly from the terminal as it requires some additional tools to be installed first which you can call prerequisites and without them you cannot install this utility as shown below.
So, to find those necessary tools, you can take the help from the perf command by typing.
$ perf --version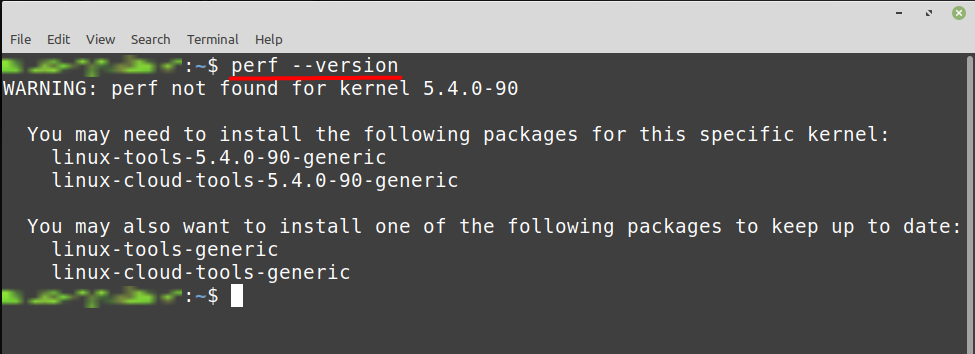
After writing that command you can see that the perf command is not available to be used but can be installed with either package from the two that are mentioned in the image. So in our case we have installed the first package by typing.
$ sudo apt install linux-tools-generic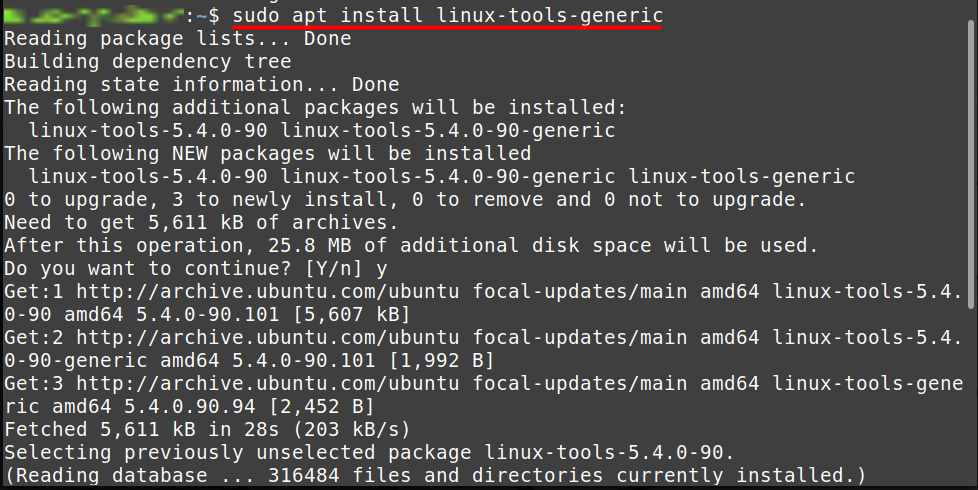
After that you should be able to use the perf utility and you can verify this by typing again.
$ perf --version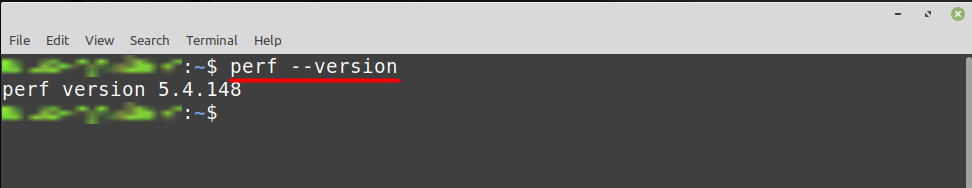
As this command is used to show the performance of your OS, that’s why this command is very critical to use and you cannot use it as a normal user as you can see in the below image.
$ perf stat ls 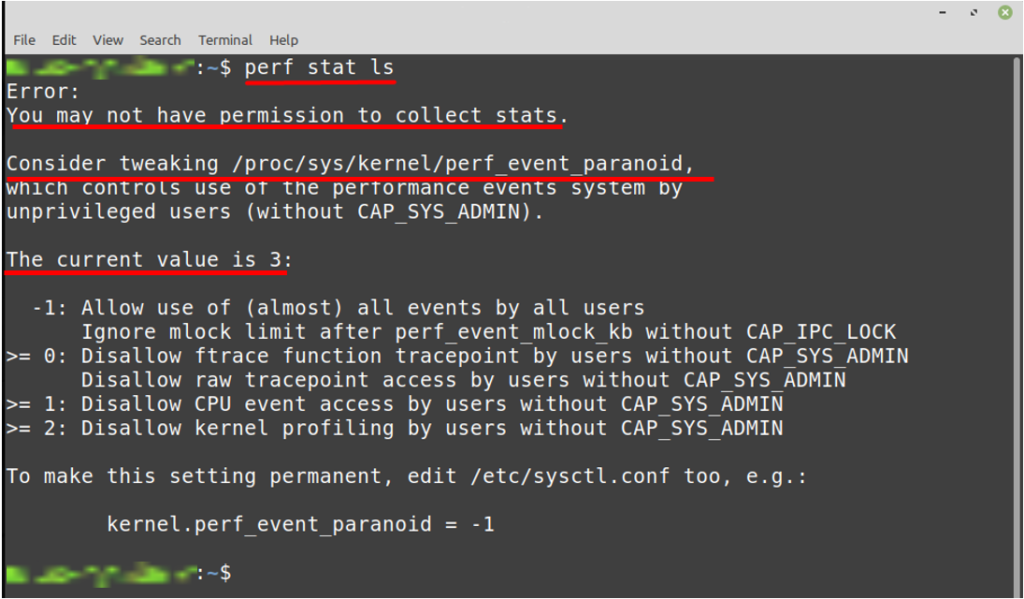
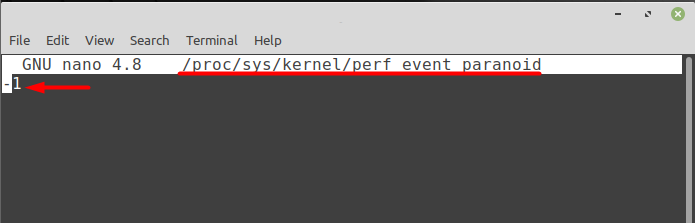
Now to get this permission you need to open and edit a /proc/sys/kernel/perf_event_paranoid file using any editor that you have. This information is also mentioned in the above image and also the value of this file is 3 by default so you also need to change the value to 0 or -1 as per your choice. For example we will open this file using a nano editor and for that we will type.
$ sudo nano /proc/sys/kernel/perf_event_paranoid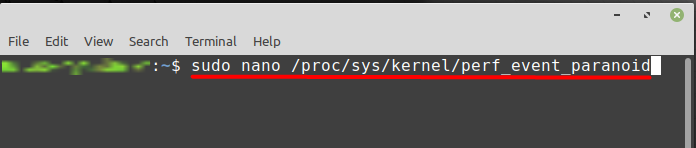
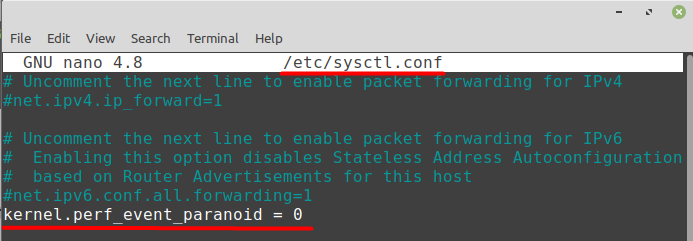
Now to make these change permanently you need to edit another file which is /etc/sysctl.conf. After that you need write the command mentioned to get the access of the command.
Kernel.perf_event_paranoid = 0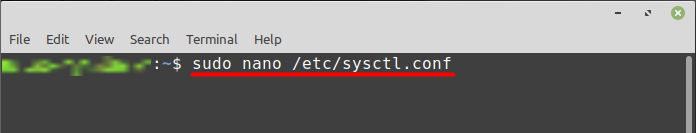
How to list all the events using a perf command
As you know that previously we don’t have any access of perf command but after making the above change now you can use this command and can be able to see the list of all events along with the statistics by typing.
$perf stat ls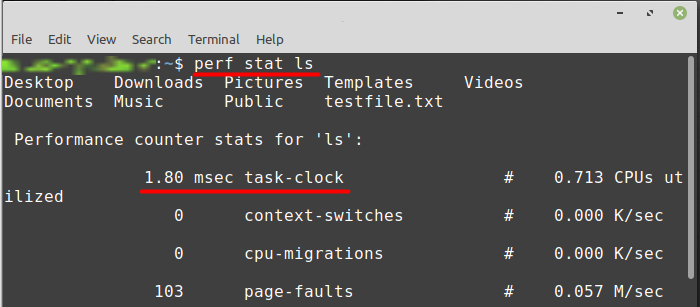
The above command is indicating the performance of the list (ls) command and you can see that it took around 1.80 msec to load the results of this command. If you want to show all the events in different categories than you can do that by typing.
$ perf list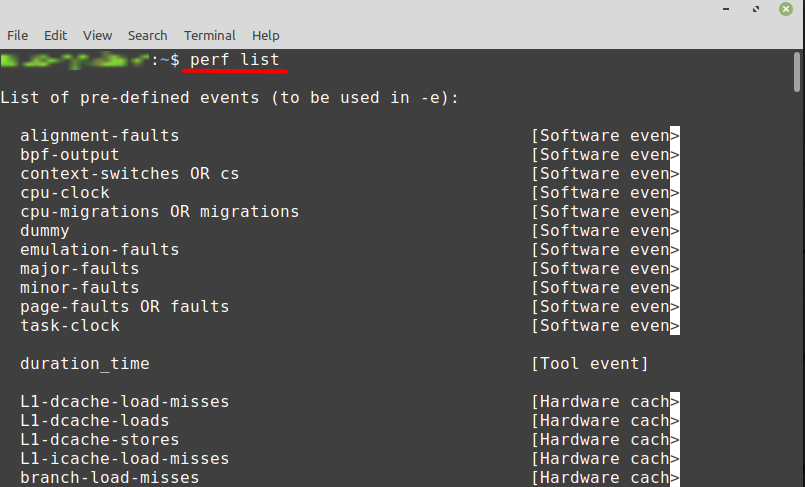
As you can see that all the events are now categorize into software and hardware events. So if you are interested specifically in a single type of event than you can do that by typing
$ perf list swThis command will you all the events which are software based as shown below and you can also get the information of hardware related events by typing.
$ perf list hw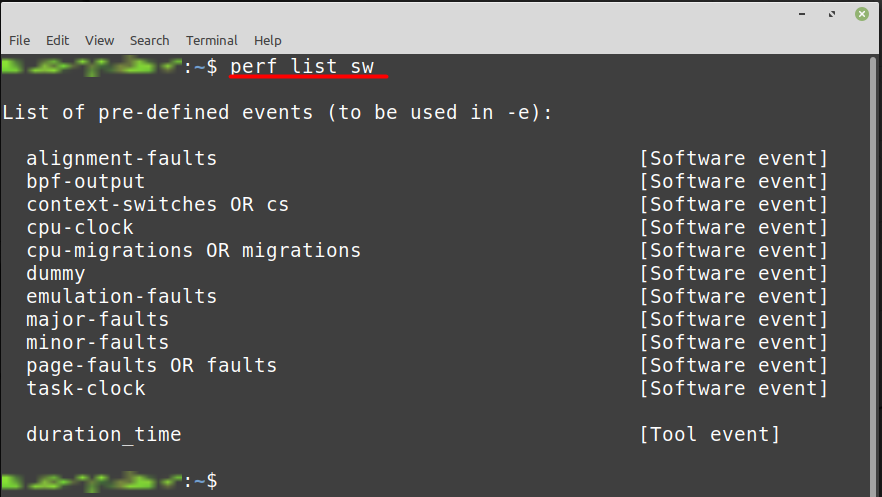
Conclusion
In this article, we have gone through the perf command, which is useful for looking at your system’s CPU performance and events. The perf tool helps you improve your system by revealing which applications take the longest to execute. However, using this utility is not as simple as it seems. First you need to install some packages, and then you also need to make some changes to your system file to get access, which is also discussed in this article.

Saryia is a technology entrepreneur and digital publisher specializing in Linux, open-source technologies, and developer education.