
In Linux, GDB (GNU Debugger) is a powerful command-line tool used for debugging programs. It provides several commands to help users to debug the code, i.e., step-into, step-over, and step-out. These commands are beneficial for navigating through code and identifying issues while debugging.
This article will demonstrate the methods of step-into, step-over, and step-out with GDB in Linux:
Prerequisite: Install GDB
Ensure that the GDB is installed on the Linux system. To install GDB on different Linux distributions, execute the “gdb” commands:
$ sudo apt install gdb   #Ubuntu, LinuxMint and Debian
$ sudo yum install gdb   #CentOS
$ sudo dnf install gdb   #Fedora
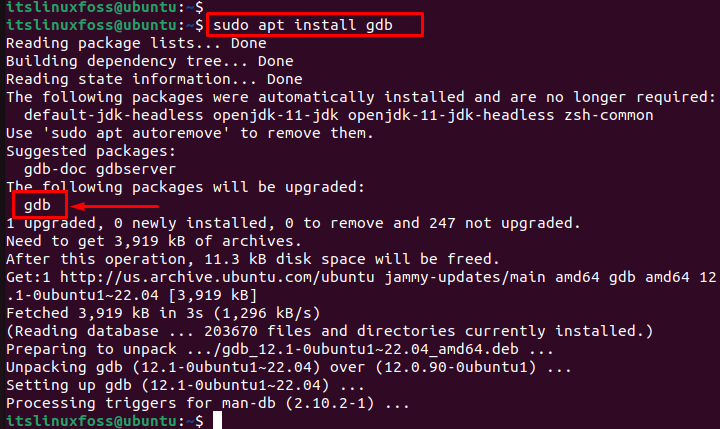
The output returns that “gdb” has been successfully installed with all dependencies.
Sample Code
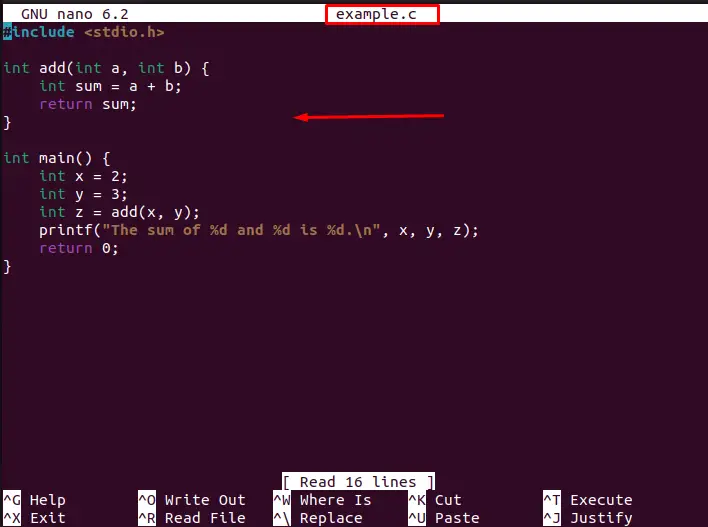
A sample code is considered to perform various operations including step-into, step-over, and step-out with GDB:
#include <stdio.h>

int add(int a, int b) {
    int sum = a + b;
    return sum;
}

int main() {
    int x = 2;
    int y = 3;
    int z = add(x, y);
    printf("The sum of %d and %d is %d.\n", x, y, z);
    return 0;
}
In this code, a method “add()” is declared in which two variables a and b are initialized and returns their sum in the “sum” variable. After that, the “add()” function is called in the “main()” by assigning two predefined values, “2” and “3”, storing their output to the “z” variable and displaying via the “printf” command.
How to Step Into Using GDB?
In the step-into command, GDB executes the next line of code and enters any function calls that the line may contain. This means that if the next line of code calls a function, GDB will stop at the first line of that function, allowing users to step through it line by line.
Compile C Program
Before the step-into functionality, compiling the sample program is necessary. For instance, compile a C program named “example.c” with debugging symbols “o” via the GCC utility:
$ gcc -g example.c -o example

The output shows that “example.c” has been successfully compiled.
Note: Users can install the GCC utility by executing the “sudo apt install gcc” command in Debian-based Linux systems.
Set a Breakpoint
To start GDB, run the “gdb” command by specifying the sample program. After that, set a breakpoint in the code via the “break” keyword.
To set a breakpoint at the beginning of the main function, use the following command:
gdb example
break main
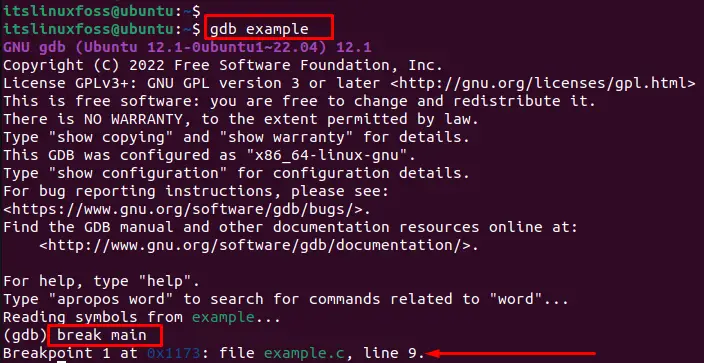
The output shows that the breakpoint has been set at the beginning of the “main()” function.
Start Program
To start the program, execute the “run” command as seen in the below figure:
run
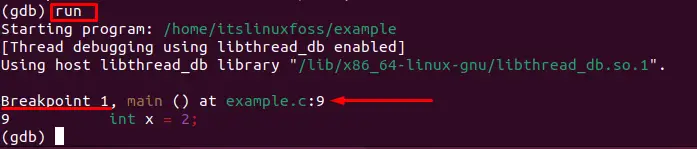
Once the program stops at the breakpoint, use the following commands to step through existing code:
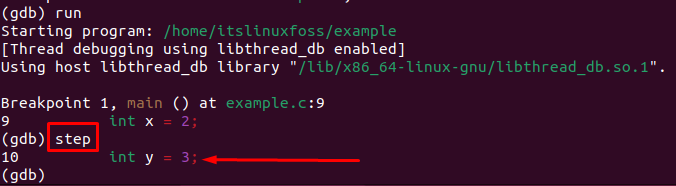
Example: Step Into a Function Call
To step into a function call, use the “step” command. For example, to step into a function call to a function named “main()“, execute the following command:
step
How to Step-over in GDB?
The “step-over” command is similar to “step-into” but does not enter any function calls that the next line of code may contain. Instead, it executes the next line of code in the current function and stops there.
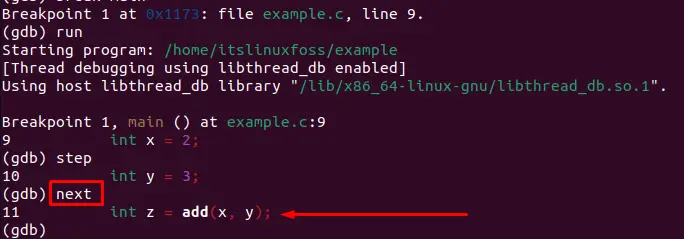
Example: Step Over a Function Call
The “next” command is used to step over a function call. Here, the “next” command is used to step over a function call to a function named “main()“:
next
How to Step-out in GDB?
The “step-out” command is utilized to step out of the current function and return to the calling function. When using this command, GDB executes the remaining lines of code in the current function and stops at the first line of code in the calling function.
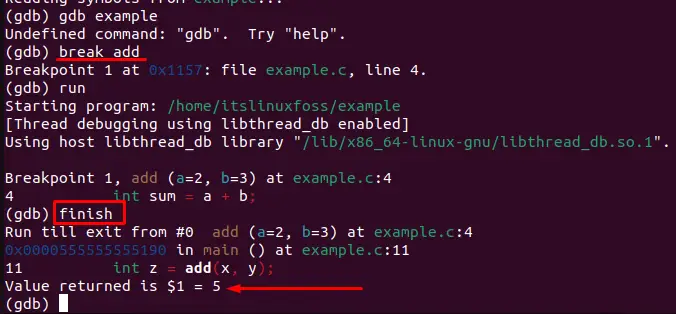
Example: Step Out of a Function Call
The “finish” command is used to step out of a function call. This is practiced in the following example code to step out of a function call and return to the caller:
finish
Continue stepping through code as needed, using the appropriate commands for your situation.
To finish debugging, use the “quit” command that requires confirmation in the form of “y” or “n”. In our case, press “y” to quit the debugging session:
quit
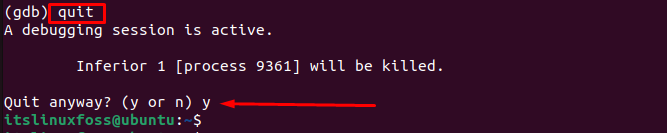
The output shows that the debugging session has been killed.
Conclusion
The “step”, “next”, and “finish” commands are utilized to step into, step over, and step out with GDB. These GDB commands allow users to identify and fix running program bugs quickly. Remember here that there is a need to set a breakpoint to step through the code, i.e., the “break” keyword.
This article has explained the detailed procedure to step into, step over, and step out with GDB in Linux.