
Pandas is a powerful and widely used library that provides numerous functions to perform various data manipulation and analysis tasks in Python. Creating a correlation matrix is a common data analysis task that shows the relationship between different variables in a data set.
In this tutorial, we will use the “df.corr()” function of the panda’s module to create a correlation matrix. This tutorial will discuss the following contents:
Using Pandas “df.corr()” Function to Create a Correlation Matrix
To create a correlation matrix or to find the correlation matrix of each column the “df.corr()” function of the panda’s module is used in Python. The following examples demonstrate how to find the correlation matrix of a given data frame:
Example 1: Correlation Matrix of Pandas DataFrame
In the below code, the “data_frame.corr()” is used to find the correlation matrix of each column:
Code:
import pandas as pd
data_frame = pd.DataFrame({'Team-1': [10, 20, 30, 40],
        'Team-2': [40, 30, 20, 10],'Team-3': [100, 150, 170, 210]})
correlation_matrix = data_frame.corr()
print(correlation_matrix)
- The “pd.DataFrame()” function accepts the dictionary value as an argument and returns a data frame.
- The “data_frame.corr()” finds the correlation of each column of the given data frame.
Output:
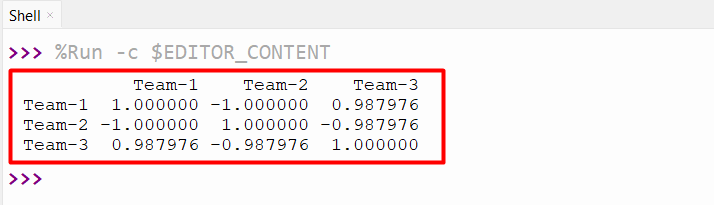
The correlation matrix of the given data frame has been successfully created.
Example 2: Plotting Correlation Matrix Using Matplotlib and Seaborn Module
In the below code, the correlation matrix is plotted using the built-in functions of the “seaborn” module and “matplotlib” module:
Code:
import pandas as pd
import seaborn as sn
import matplotlib.pyplot as plt
data_frame = pd.DataFrame({'Team-1': [10, 20, 30, 40],
        'Team-2': [40, 30, 20, 10],'Team-3': [100, 150, 170, 210]})
correlation_matrix = data_frame.corr()
sn.heatmap(correlation_matrix, annot=True)
plt.show()
- The “seaborn” module and “matplotlib” module are imported into the program.
- The “pd.DataFrame()” function accepts the data and creates the DataFrame accordingly.
- The “data_frame.corr()” function creates the correlation matrix of the given DataFrame and stores it in a variable named “correlation_matrix”.
- The “sn.heatmap()” accepts the correlation matrix value and returns the graphical representation of the matrix value using color.
- The parameter “annot=True” is used to write the correlation matrix value into each cell.
- The “plt.show()” module is used to display the plotted heatmap.
Output:
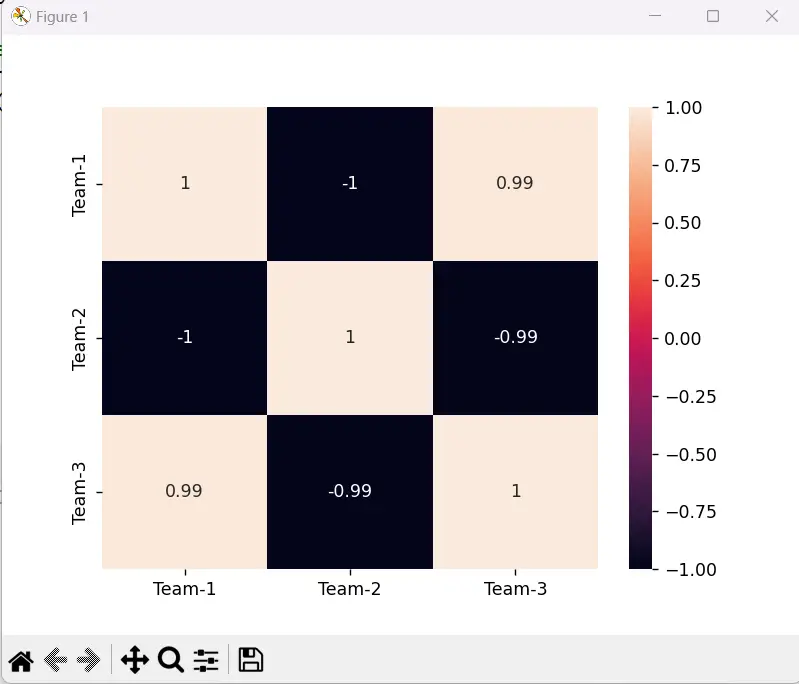
The correlation matrix value has been graphically represented using the “sn.heatmap()” function.
Conclusion
To create a correlation matrix the “df.corr()” function of the Pandas module is used in Python. The visual representation of the correlation matrix can also be plotted using the “seaborn” and “matplotlib” modules. The “sn.heatmap()” plots the correlation matrix of the given DataFrame using various colors and the “plt.show()” function displays the plotted heatmap. This blog delivered an in-depth overview of how to create a correlation matrix and how to visually represent the correlation matrix in Python.