In Google Docs, Bar Graph is used to convey relational information visually. It displays the data in the form of an x-axis and a y-axis (horizontal and vertical). The bar graph summarizes large data in the imaged form. It’s better to display the comparisons of any data in the bar graph compared to tables. Keeping in view the importance of the Bar graph, this post will provide a method to create a bar graph in Google Docs.
Let’s start this guide.
How to Make a Bar Graph in Google Docs?
Google Docs provides the feature to make a bar graph in the document. In this method, the “Insert” tab will be used to make a bar graph. However, the graph information can be edited in Google Sheets. Let’s perform this practice and see how it works:
Step 1: Open the Document
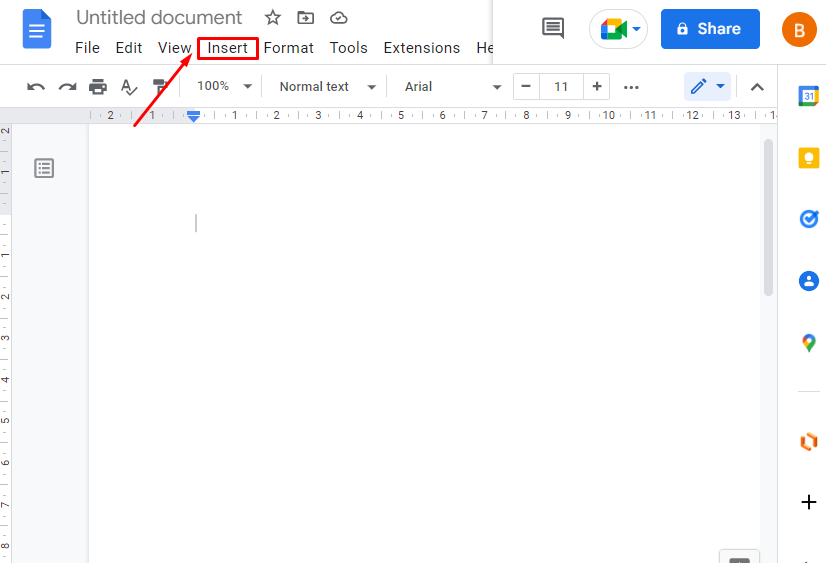
Open the blank document and hit on the “Insert” tab from the menu bar:
Step 2: Create a Bar Chart
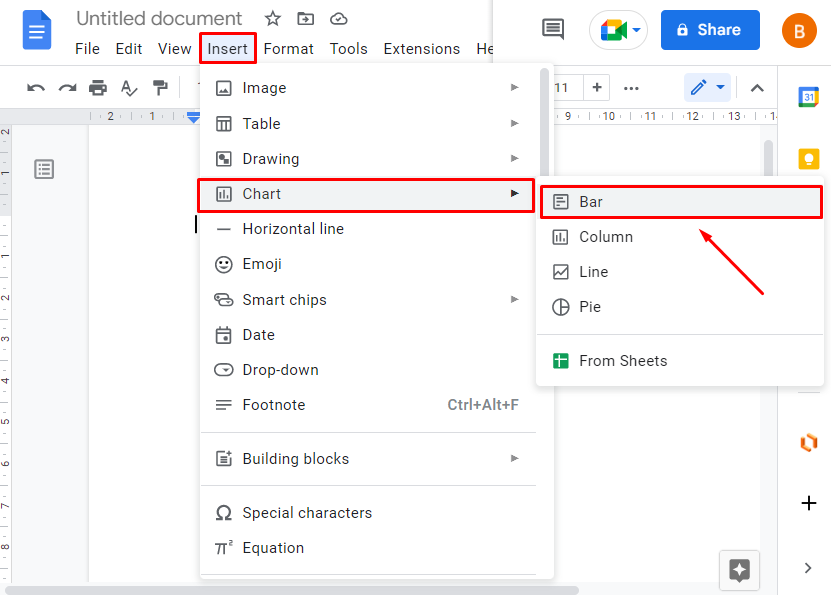
The next step is to hover on the “Chart” option and then hit on “Bar” from the drop-down:
Step 3: Edit in Google Sheets
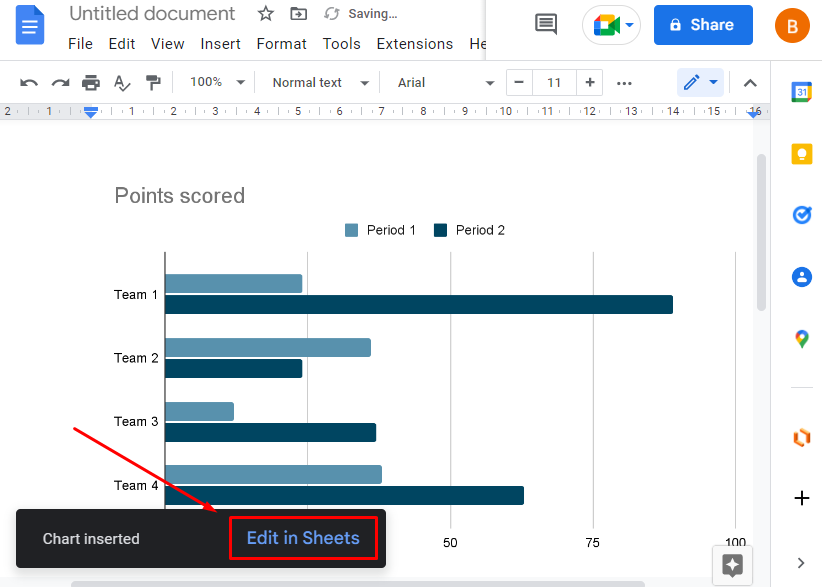
The bar graph will be added by performing the above step Now, click on the “Edit in Sheets” option from the bottom right side:
Step 4: Insert the Data
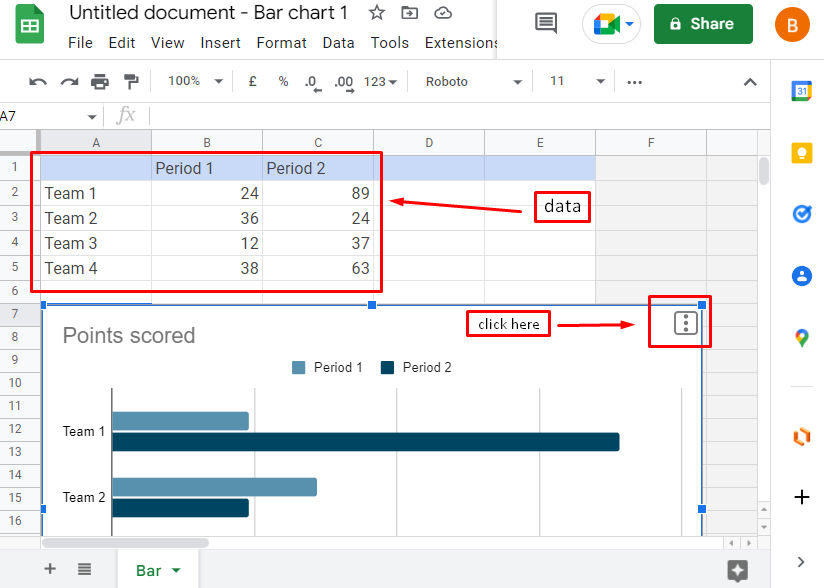
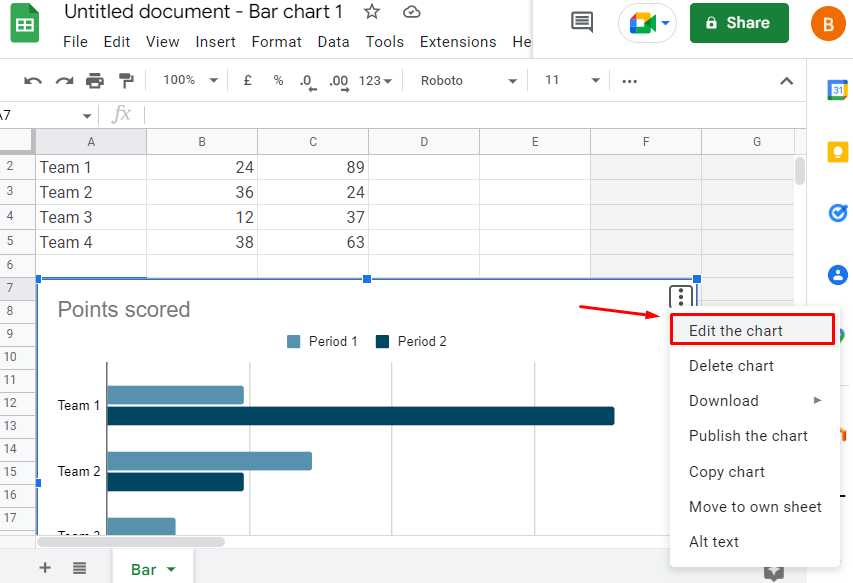
Click on the chart and then on the 3 dots available on the top right side:
Now, click on the “Edit the chart” option from the drop-down:
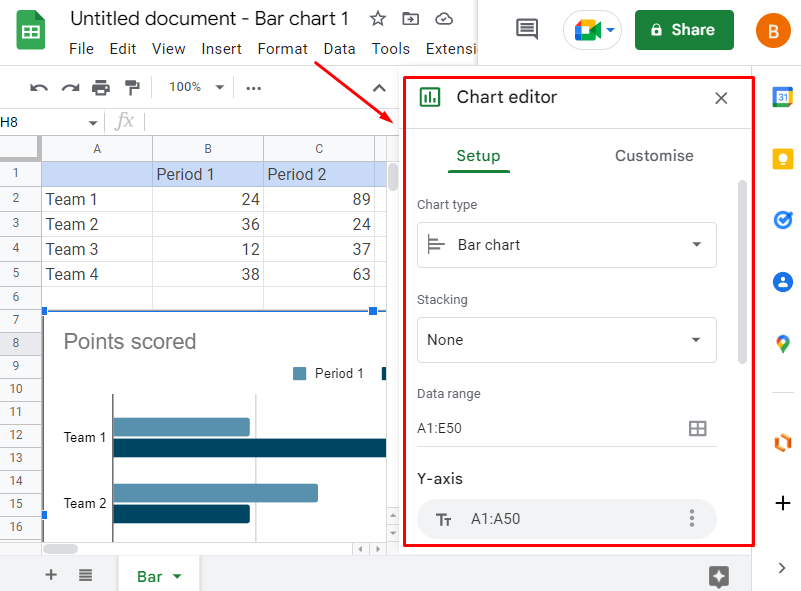
Users can apply some changes according to their preferences and requirements from the sidebar:
Step 5: Import the Graph into Google Docs
Apply the changes to the graph and paste the graph into Google Docs. As in our scenario, the stacked bar chart and the color of the graph have been changed. The process of copy-pasting can be seen below “GIF”:
In this way, a bar graph can be made in Google Docs.
That’s all from this guide!
Conclusion
A Bar Graph is added using the “Insert” tab from the MenuBar, and this Graph is edited in the Google sheets. While editing, the user can customize the graph as per their requirement/preference. After applying the required changes, the graph is imported into Google Docs. In this article, the method of making a bar chart has been explained in detail.