
The “nstat” command in Linux is a command-line utility that allows users to monitor various network-related statistics on their system. It includes information about network interfaces, TCP and UDP connections, and IP routing. This command is useful for troubleshooting network issues and monitoring network activity.
This article will briefly explain the “nstat” command with general syntax and possible examples.
- How Does nstat Command Work in Linux?
- Display Network Statistics for All Interfaces
- Display Network Statistics in JSON Format
- Display Network Statistics of Specific Protocol
- Reset History of Network Statistics
- Display Network Statistics in Specific Format
How Does nstat Command Work in Linux?
The “nstat” command gathers detailed information about network traffic, including the number of packets sent and received, the number of errors and collisions, and the amount of data transferred.
The basic syntax of the “nstat” command in Linux is as follows:
Syntax:
$ nstat [options]
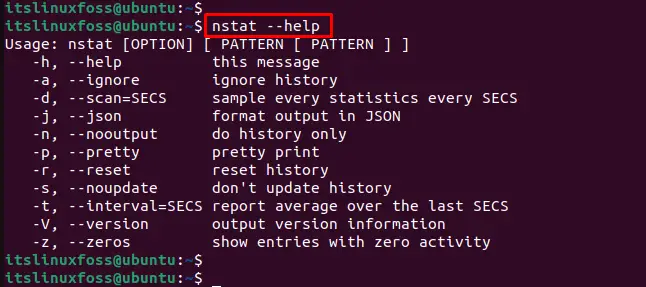
In the above syntax, “options” are any additional parameters that offer various functionalities and can be seen via the command:
$ nstat --help
Let’s carry out the different examples of the “nstat” command.
Example 1: Display Network Statistics for All Interfaces
To visualize the network statistics for all interfaces, execute the “nstat” command without any argument as below:
$ nstat
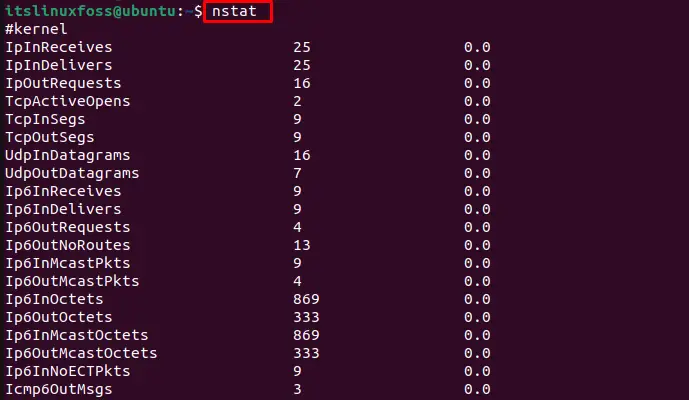
The output displays the current statistics for all network interfaces on a system. It includes information on the number of packets received and transmitted, the number of errors and collisions, and the number of bytes received and transmitted in the different rows.
Example 2: Display Network Statistics in JSON Format
To represent the network statistics in JSON format, the “JSON” utility is used with the “nstat” command as shown below:
$ nstat --json
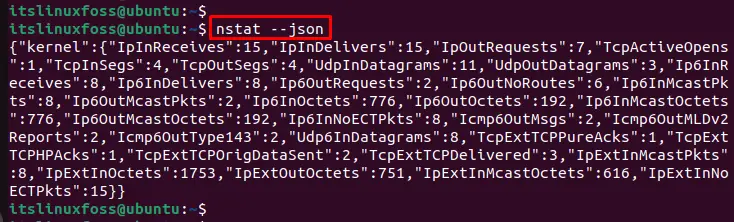
The information of network statistics can be visualized in JSON format.
Example 3: Display Network Statistics of Specific Protocol
Users can specify the protocol name to display the network statistics. For instance, check the packets received from the “IpInReceives” as below:
$ nstat IpInReceives
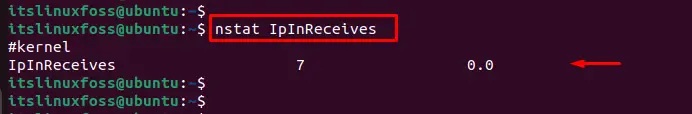
The output returns the number of packets received is 7 from the “IpInReceives” kernel.
Example 4: Reset History of Network Statistics
In this example, you can reset the history of network statistics by utilizing the “r” option. For instance, the below command will reset the old history and consider only the recent statistics of the network:
$ nstat -r
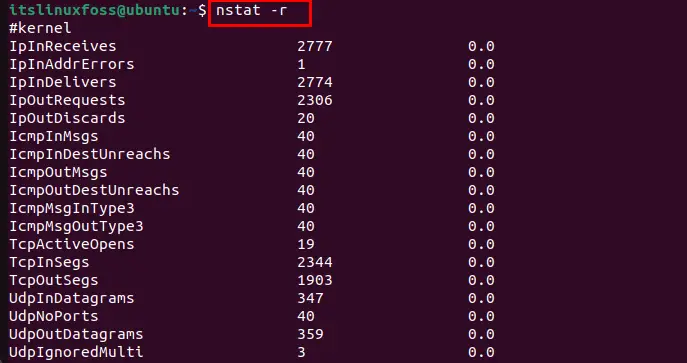
The output reset the previous count and displays the recent network statistics in the terminal.
Example 5: Display Network Statistics in Specific Format
To represent the network statistics in a specific format such as “zero” to hide from other users, the “z” option is utilized with the “nstat” script as below:
$ nstat -z
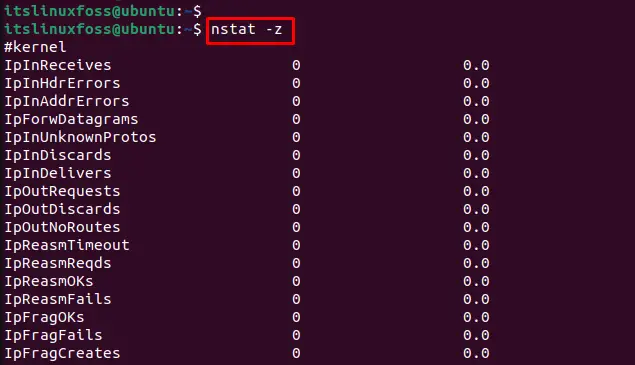
The output returns all the values in the zero format in the terminal.
Conclusion
Linux offers the “nstat” command to display the real-time network statistics in the terminal. Using this command, you can display information about specific kernels or visualize network statistics in different formats, such as JSON. This guide has briefly explained the “nstat” command along with various examples.