Multiple open-source and inbuilt modules are used to perform certain operations in Python. For instance, the “Matplotlib” module is used in Python to demonstrate data graphically or pictorially analyze data. To plot a graph along with data labeling such as x-label, y-label, etc., the “Matplotlib” module provides various functions.
This post will plot a line chart in Python using Matplotlib with the following outline:
- How to Plot a Line Chart in Python Using Matplotlib?
- Example 1: Plotting Line Chart Graph Using Matplotlib
- Example 2: Plotting Line Chart Graph Using Matplotlib and Pandas
- Example 3: Plotting Multiple Line Chart Graph Using Matplotlib
How to Plot a Line Chart in Python Using Matplotlib?
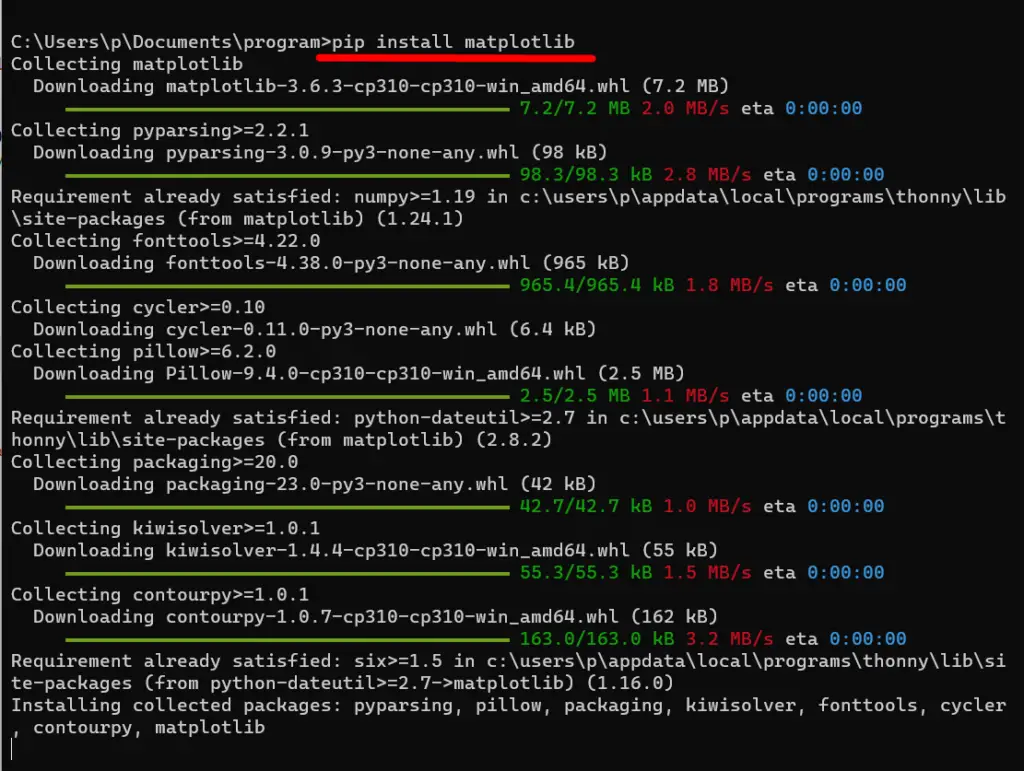
To plot a line chart using the matplotlib function, you must have the matplotlib library installed in our system. If you don’t have this library in your system, you can use the following code in the terminal window to install the library in Python.
> pip install matplotlib
Below is an example snippet of how the above command is used in the CMD terminal to install the Python matplotlib library:

Example 1: Plotting Line Chart Graph Using Matplotlib
In the example given below, the “plot()” function of the “matplotlib” module is used to plot the line chart graph:
Code:
import matplotlib.pyplot as plot
Time = ['9:20', '8:30', '9:40', '9:50', '9:60', '10:00', '10:10', '10:20', '10:30', '10:40']
Speed = [17, 10, 60, 82, 79, 50, 25, 32, 45, 33]
plot.plot(Time, Speed)
plot.title('Speed Time Graph')
plot.xlabel('Time')
plot.ylabel('Speed')
plot.show()
In the above code:
- The “Time” and “Speed” values are initialized at the “x-axis” and “y-axis” in the form of “List”.
- The “plot()” function accepts the “x-axis” and “y-axis” values as an argument and returns the plot.
- The “title()”, “xlabel()” and “ylabel()” functions are used to represent the name of the graph, the x-axis and y-axis label of the graph.
- The “show()” function of the “matplotlib” module is used to show the plotted graph in the output.
Output:

The above output shows the “Line Chart” graph of given values.
Example 2: Plotting Line Chart Graph Using Matplotlib and Pandas
In the following code, the “pd.DataFrame()” function creates the DataFrame that contains the “x-axis” and “y-axis” values.
Code:
import pandas
import matplotlib.pyplot as plot
data_frame = pandas.DataFrame({'Time' : ['9:20', '8:30', '9:40', '9:50', '9:60'],
              'Speed' : [17, 10, 60, 82, 79]})

plot.plot(data_frame['Time'], data_frame['Speed'])
plot.title('Speed Time Graph')
plot.xlabel('Time')
plot.ylabel('Speed')
plot.show()
In the above code:
- The “pd.DataFrame()” accepts the “x-axis” and “y-axis” values in the form of a Dictionary and returns the DataFrame.
- The “plot()” function of matplotlib accepts the DataFrame column name as an argument inside the square bracket and plots the line chart graph.
Output:

The above output shows the line chart graph for “Speed” and “Time”.
Example 3: Plotting Multiple Line Chart Graph Using Matplotlib
We can plot multiple line chart graphs using the matplotlib library in Python. Here is an example of how we can do this in Python:
Code:
import matplotlib.pyplot as plot
import numpy
x_1 = numpy.array([12, 22, 33, 14])
y_1 = numpy.array([2, 12, 13, 24])
x_2 = [22, 24, 26, 28]
y_2 = [32, 52, 72, 29]
plot.plot(x_1, y_1)
plot.plot(x_2, y_2)
plot.xlabel("X-axis")
plot.ylabel("Y-axis")
plot.title('Multiple plots')
plot.show()
In the above code:
- Two “x-axis” values “x_1” and “x_2” and two “y-axis” values “y_1” and “y_2” are initialized in the program.
- The matplotlib function named “matplotlib.pyplot.plot()” is used to plot the multiple line chart graph.
Output:

The multiple-line chart graph is illustrated in the above output.
Conclusion
To plot a line chart in Python, a function named “plot()” of the “matplotlib” module is used. The multiple-line chart can also be plotted into graphs using the matplotlib function. The “pandas.DataFrame()” is used along with the “matplotlib” module to plot the given DataFrame as a line chart graph. The “matplotlib” provides functions to display the title, x-label, y-label, etc., of the line chart. This Python post delivered various examples of plotting a line chart in Python using the matplotlib module.
